
Many listed infrastructure companies provide customers with cleaner and greener services than the alternatives. This paper looks at how US-listed railroads, electric and water utilities are reducing carbon emissions, improving safety and increasing customer satisfaction. We believe these sustainability benefits are going to be valued more highly in the future by customers, regulators, politicians and investors.
The essential service nature of listed infrastructure makes sustainability a key value driver for the asset class. Many listed infrastructure companies provide cleaner and greener services than the alternatives.
This article reviews the environmental and social benefits that US-listed railroads, electric and water utilities provide, relative to customer alternatives. We believe these benefits will gain increased recognition in the future and listed markets will value these companies accordingly.1
Railroads
Transportation is the largest producer of carbon emissions in the United States (US). Freight is moved by trucks, railroads, pipelines, barges, the postal service and aircraft. Railroads account 28%2 of US freight, competing mainly against trucks with 40% market share.
Freight railroads have multiple sustainability benefits relative to the trucking alternative. Environmentally, they are three to four times more fuel efficient than trucks.3 A US freight train can move a ton of freight by an average of 472 miles per gallon of fuel4; while a truck moves a ton of freight by an average of 140 miles, for each gallon of fuel consumed. This fuel efficiency means that moving freight via rail reduces greenhouse gas (GHG) emissions by 75%. Hence while railroads move 28% of freight, they account for only 2% of the US’ transportation related GHG emissions.5
Now that’s fuel (and carbon) efficiency by railroads
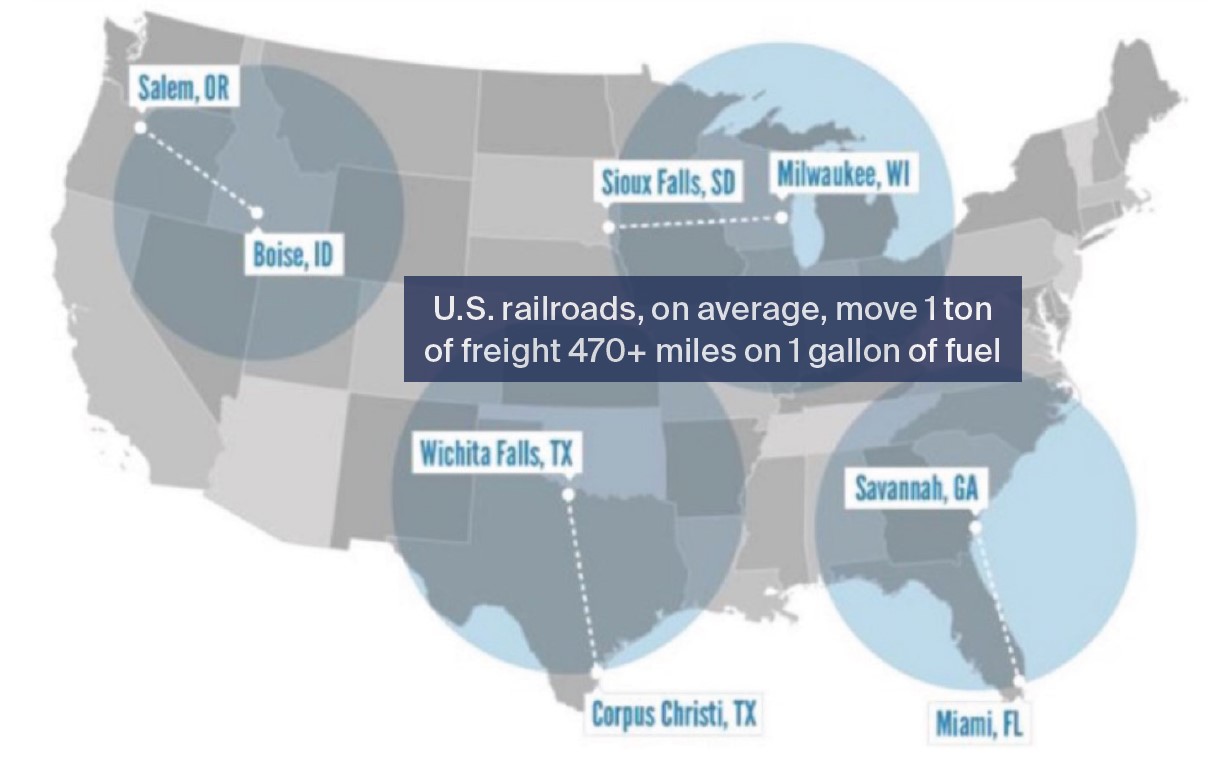
Source: Association of American Railroads (AAR). As at 31 March 2021.
US railroads have a strong track record of improving their fuel efficiency. The graph on the following page shows the large improvements railroads have made in fuel efficiency relative to trucks over the last 30 years.
Rail vs Truck fuel efficiency
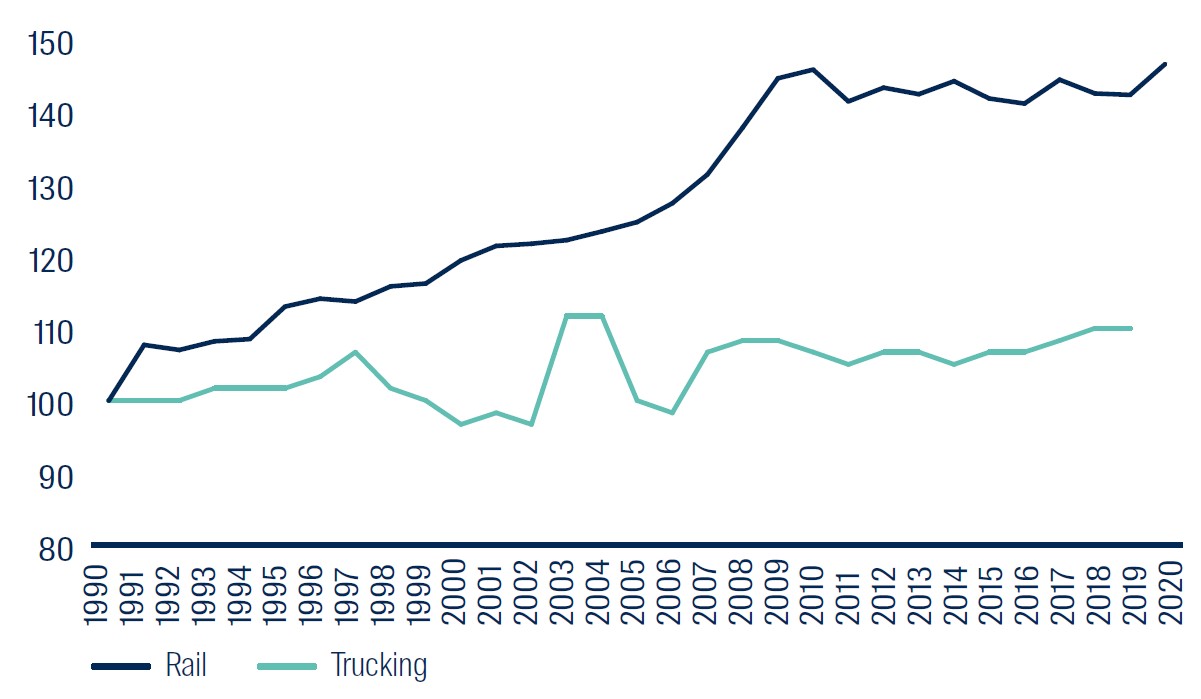
Source: AAR, FSI
Capital investment by railroads in newer, more fuel efficient locomotives is further driving down GHGs via improved fuel efficiency. CSX Corporation6 has reduced its GHG emissions intensity by 13.8% since 2014.7 Norfolk Southern has improved its fuel efficiency by 9.4% since 2015.8
CSX Corp reductions in GHG emissions intensity
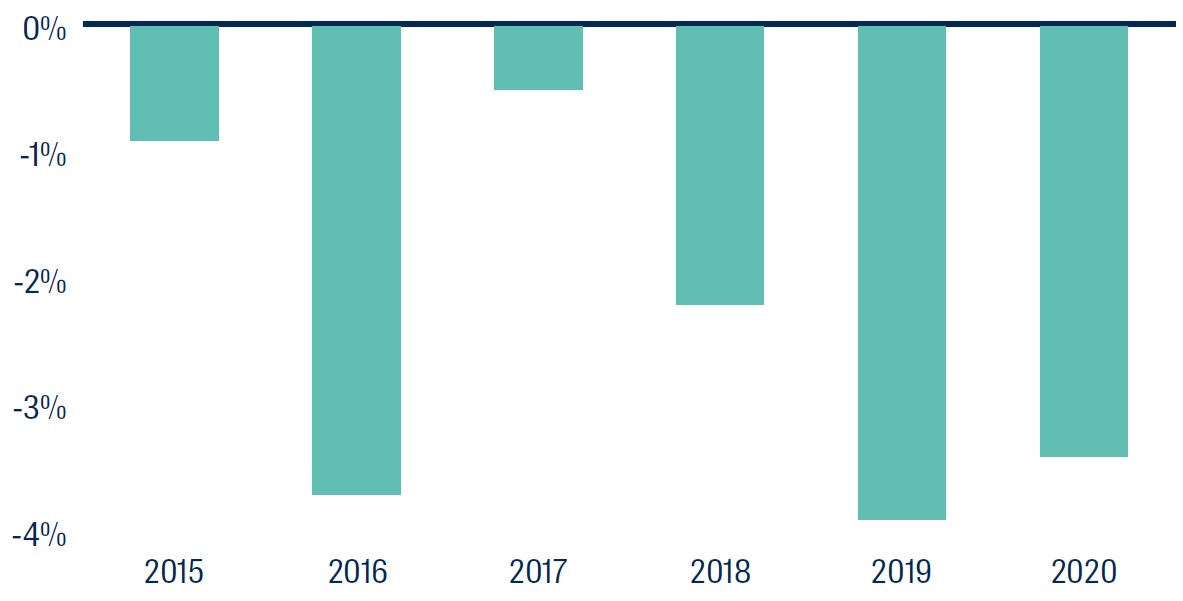
Source: CSX Corporation 2020 Environment, Social & Governance Report
Socially, railroads have many benefits relative to trucking. First, they provide a safer alternative for the movement of goods. Large trucks account for 4% of registered vehicles, 7% of vehicle miles travelled but 10% of fatal accidents.9 In 2019, accidents involving large trucks caused ~5,000 fatalities compared to ~600 involving freight railroads.10
Second, the government expenditure needed to maintain US roads and bridges would be reduced if more freight shifted from truck to rail. Roads and bridges built 50 plus years ago were not designed to carry the number and weight of trucks using these assets today. It is also worth remembering freight railroads build, own and maintain their networks and do not rely on taxpayers.
Third, highway congestion and therefore air pollution, is reduced as more freight is transported by railroads. This has both environmental and social benefits for US citizens.
Railroads are a lower carbon, more fuel efficient and safer way to transport goods relative to trucking. As corporate America looks at ways to improve sustainability, particularly carbon footprint reduction, we believe railroad customers will increasingly value these sustainability benefits relative to the trucking alternative.
Electric utilities
Electricity in the US is produced by five types of entity – investorowned utilities (IOUs), independent power producers (IPPs), the Federal government,11 public power utilities12 and cooperatives. Both IOUs and IPPs are part of the listed infrastructure asset class.
Split of US electricity generating capacity
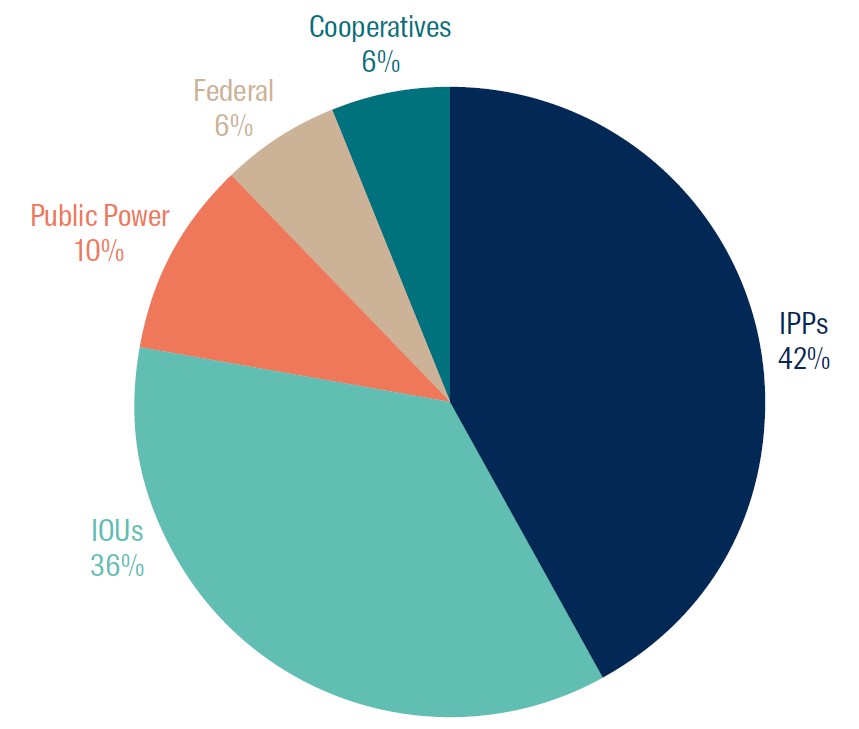
Source: American Public Power Association 2021 Statistical Report
IOUs and IPPs are significantly cleaner and greener than their government-owned electric utility peers.
First, both public power utilities and cooperatives are highly dependent on carbon heavy coal-fired power generation. Coal accounts for ~26%13 and ~32%14 of public power utilities’ and cooperatives’ electric capacity respectively, compared to ~20% for the US power generation sector as a whole. Cooperatives account for seven of the ten most coal-heavy utilities in the US.15 As customers, regulators and politicians increasing focus on climate change and reducing carbon, these coal-fired power plants will face ever higher pressure to close.
Second, wind and solar ownership in the US is dominated by listed infrastructure’s IOUs and IPPs. Government entities do not have meaningful capital to invest in the clean energy transition. Public power utilities, cooperatives and the Federal government combined only own ~1% of wind and solar generation capacity in the US. This means listed infrastructure has significant and mutually exclusive gains with the inevitable growth of carbon free renewable energy.
Third, future investment is being driven by listed infrastructure’s IOUs and IPPs. Public power utilities, cooperatives and the Federal government combined account for only 3%16 of new electricity generation capacity in the US. These government entities do not have the capital to invest while private sector players (including listed infrastructure companies) are developing renewables at a breakneck pace.
Government owned giant Tennessee Valley Authority (TVA) illustrates this inability to invest new capital needed to decarbonise the electricity sector. Since 2010, TVA has grown its asset base at only 2% pa. Capital expenditure of $2.1 billion in 2020 was below 2010 level of $2.4 billion. The chart below shows how high levels of renewable energy investment by listed infrastructure’s NextEra Energy (NEE) have enabled asset base growth relative to the stagnation of government owned TVA.
Total Assets of NEE and TVA ($ billions)
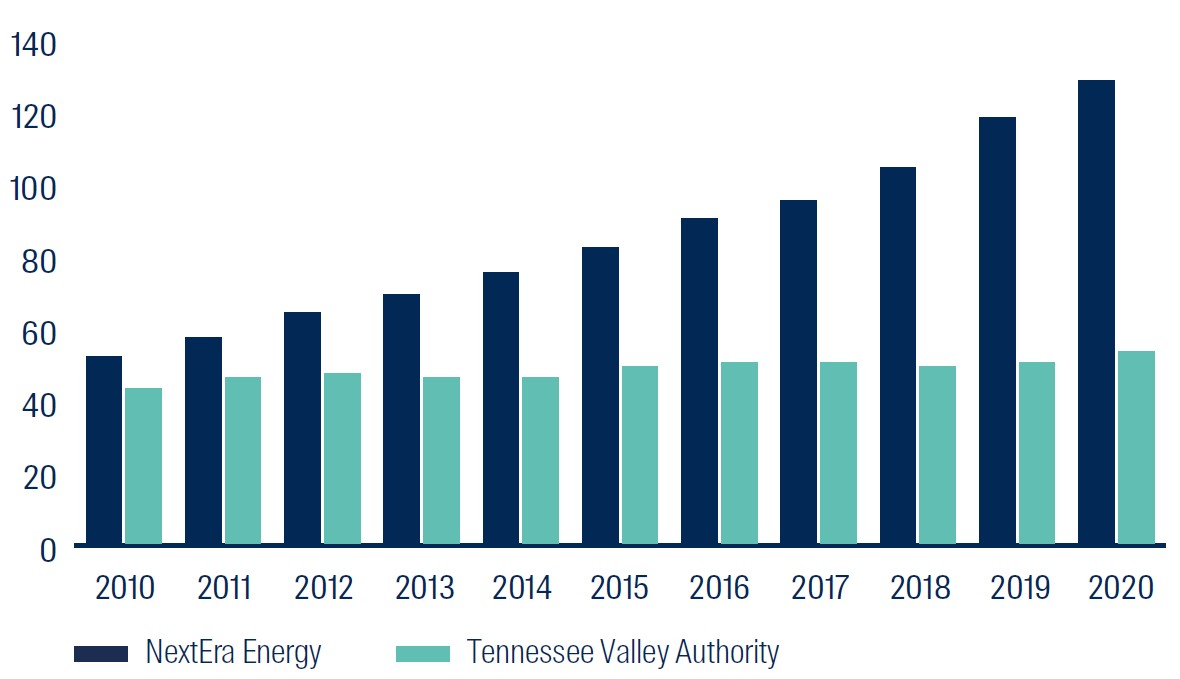
Source: Annual reports, First Sentier Investors. Data as at 31 December 2020
In summary, US-listed electric utilities are cleaner and greener than their government owned peers. Going forward, we expect these utilities to expand their market share of the US electricity generation industry due to their higher wind, solar and storage capital investment plans. While governments talk about decarbonisation, their lack of capital means that listed utilities are the ones actually achieving this.
Listed utilities are the driver of US carbon emission reductions (mt)
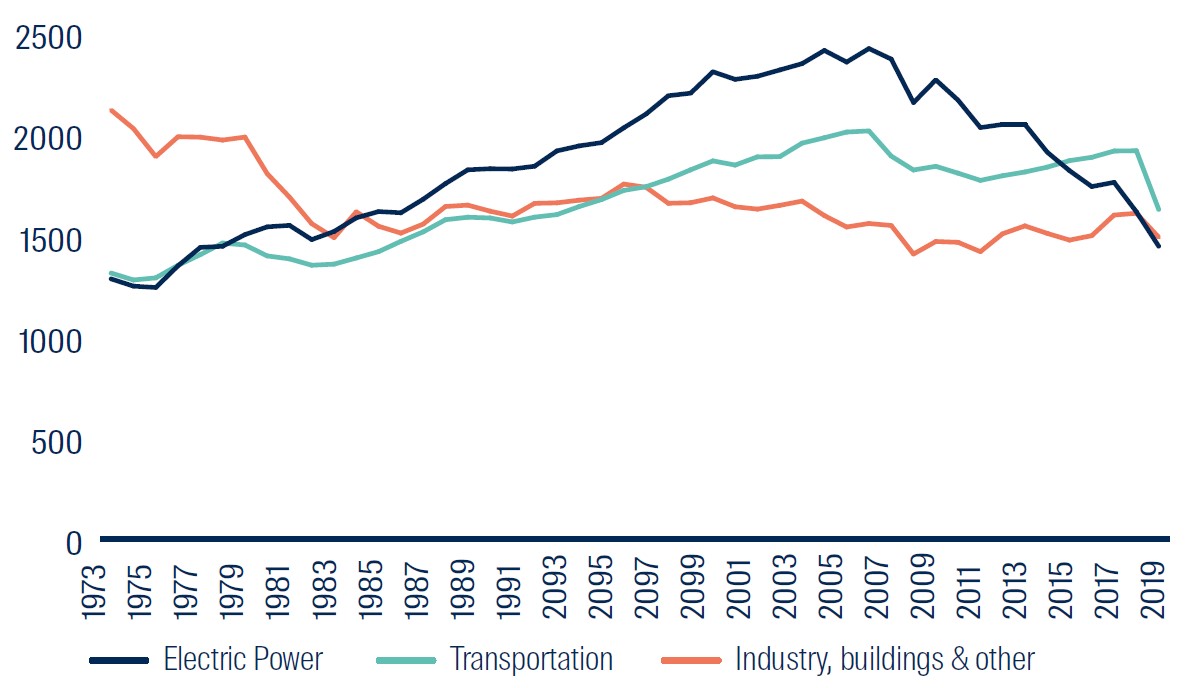
Source: Energy Information Agency, First Sentier Investors. Data as at 31 December 2021
Water utilities
Private sector investment in the US water industry remains a fraction of what it could, and should be. Ownership of US water utilities is dominated by local governments which serve ~85% of the population. The remaining ~15% is served by small private operators, and larger listed infrastructure companies like American Water Works, Essential Utilities and American States Water. In addition, over the last five years several listed electric and gas utilities (Eversource Energy, NW Natural and NextEra Energy) have expanded into the water space to deploy capital.
The water crises in Flint, Michigan (MI) and Jackson, Mississippi (MS) both happened under government ownership. The 2019 World Economic Forum Global Competitiveness Report (the latest to provide such a comparison) ranks US infrastructure 13th overall. With regards to water specifically, the US ranks 14th on ‘exposure to unsafe drinking water’ and 30th on ‘reliability of water supply’. In our view, this relatively poor performance reflects a lack of local government funding.
Water safety violations have increased over the past 20 years. This stems from a combination of increased regulation and the inability of many local authorities to invest capital to maintain (let alone improve) their water systems. Today, more than 30 million Americans live in areas where water systems violate safety rules.17
US water safety violations increasing
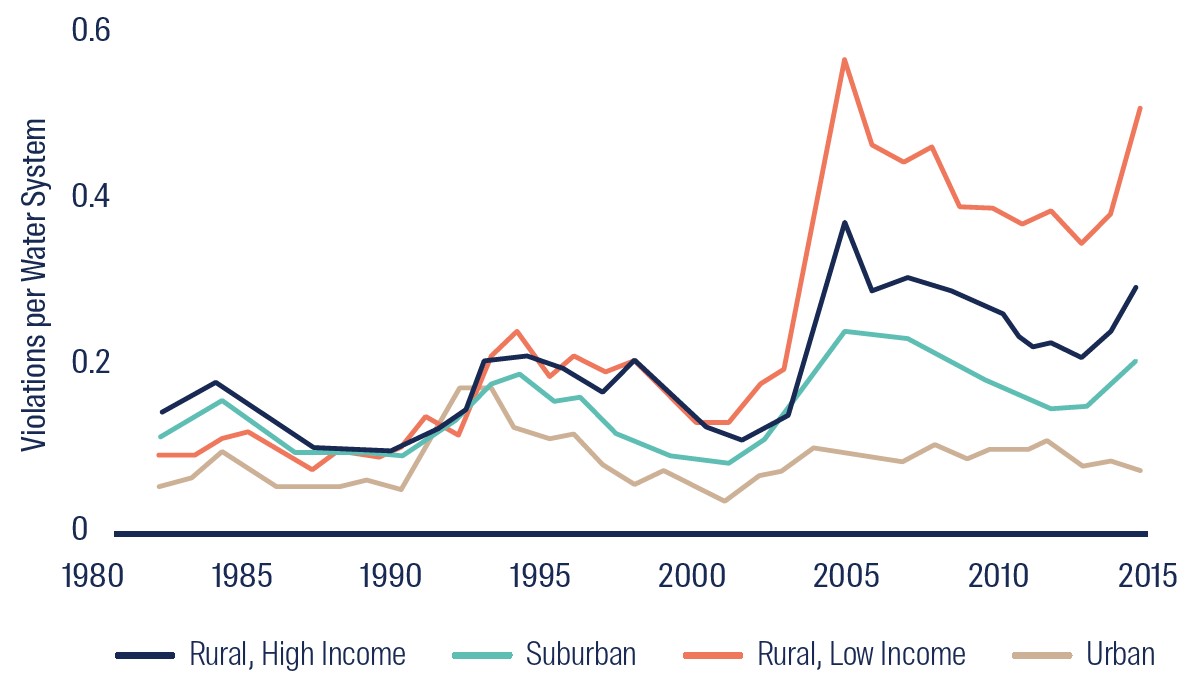
Source: ‘National trends in drinking water quality violations’ PNAS 2018
Listed water utilities offer several significant sustainability benefits relative to the public water system alternative.
First, listed water utilities provide higher quality water18 than their government owned peers. American Water Works has stated its water quality was 14x better than the industry average. Essential Utilities stated that it ‘outperformed the national average on drinking water quality by a factor of about seven times’. The National Association of Water Companies quotes a study based on data from 1982-2015 showing that privately owned water utilities had a materially lower percentage of water violations than public water systems (17% lower in California, 28% lower in Texas, 37% lower in Pennsylvania and 69% lower in New Jersey).19
Second, listed water utilities have a stronger focus on customer service. The below table shows listed water utilities (in blue) dominating the J.D. Power customer satisfaction survey. The transparency and discipline required of a publicly-listed company incentivizes listed water utilities to focus on customer satisfaction in a way that does not exist for government bureaucracies. High customer satisfaction improves these companies’ social standing in the communities they serve and reduces the political and regulatory risks.
J.D. Power 2021 Water utility customer satisfaction rankings
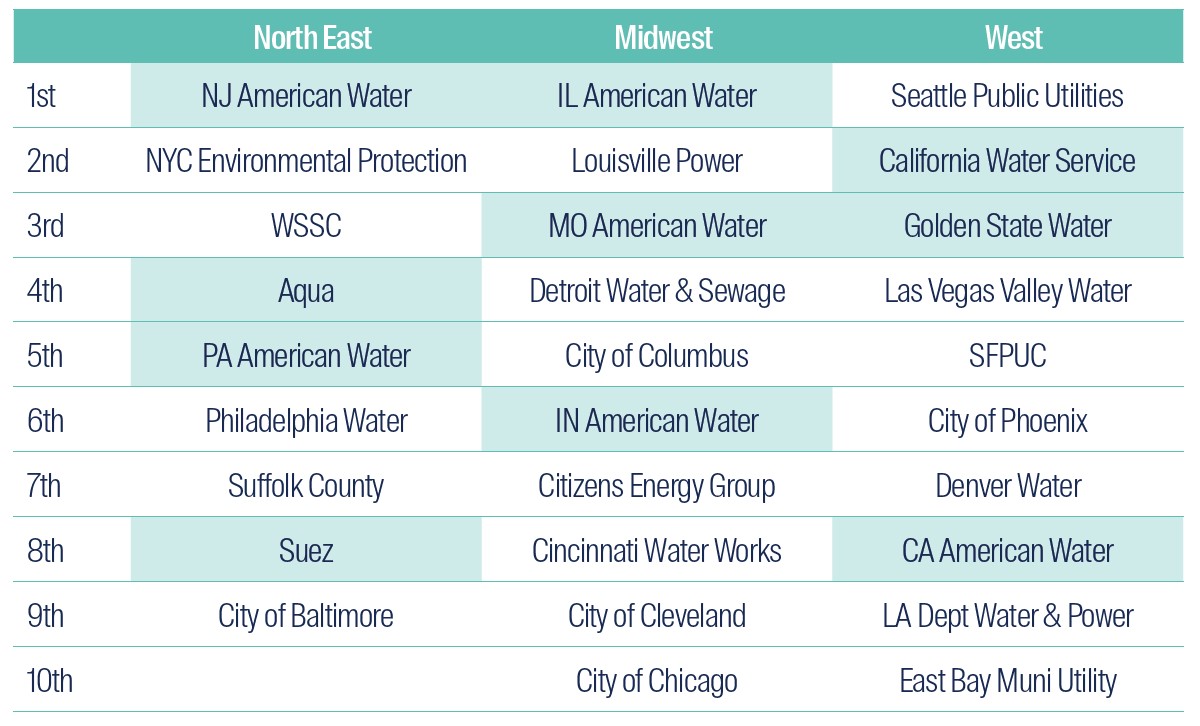
Source: J.D. Power
Third, listed water utilities are investing more capital into their water systems than either public or smaller private operators. This is evidenced by the robust 7-9% rate base growth of listed water utilities; steady acquisitions of small rural public water systems by listed water utilities; the decline in water capital investment funding from the Federal government (whose share has reduced from over 30% of the total amount in 1977 to less than 5% in 201720) and the lack of local government funding available.
The below chart, from the most recent government-owned water disaster in Jackson, MS illustrates why there is so little investment for public water systems – local governments don’t have the money.
Jackson MS water revenue and expenditure
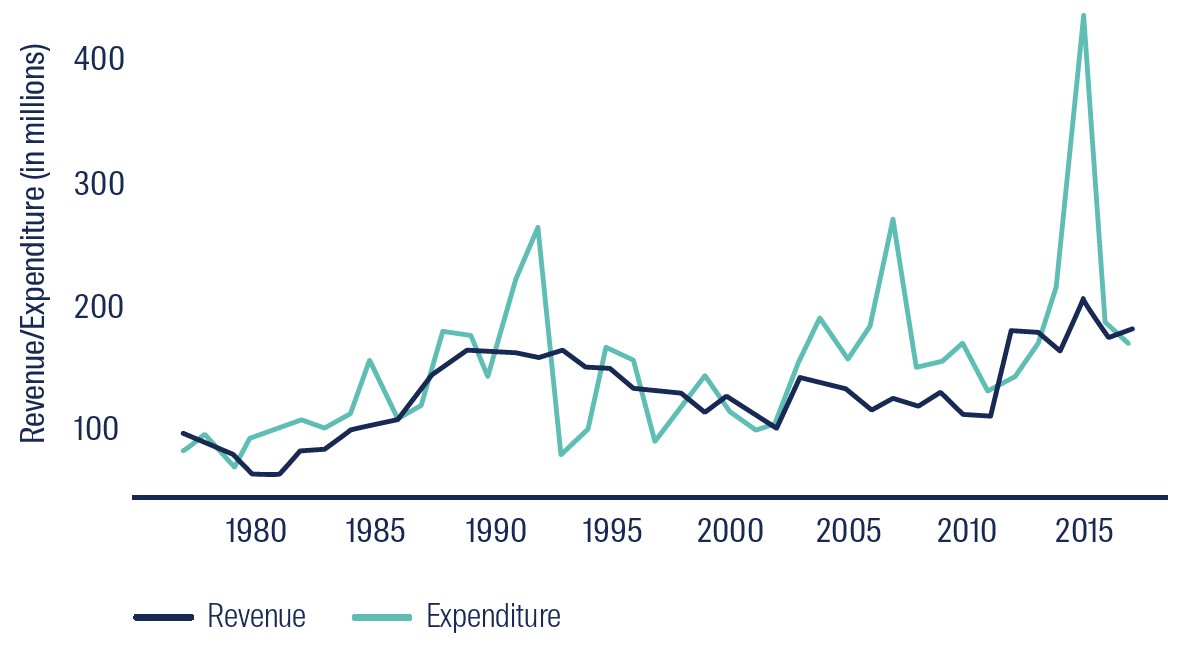
Source: Brookings Institute. Data as at 31 December 2017
Listed water utilities are improving their business practices and investing capital into their water systems to ensure that these positive environmental and social outcomes continue into the future. In contrast, capital-starved public water systems are struggling to maintain their aged assets, let alone keep up with society’s higher health and safety expectations. This public system water crisis is only getting worse as climate change induced drought in the southwest adversely impacts basic water supply. However it is encouraging to see a number of states (Texas, Illinois, Pennsylvania, New Jersey, Virginia, North Carolina, Ohio and Kentucky) introducing regulation to encourage the purchase of smaller, failing water utilities by financially robust listed peers.
Listed infrastructure stock American Water Works is not standing still
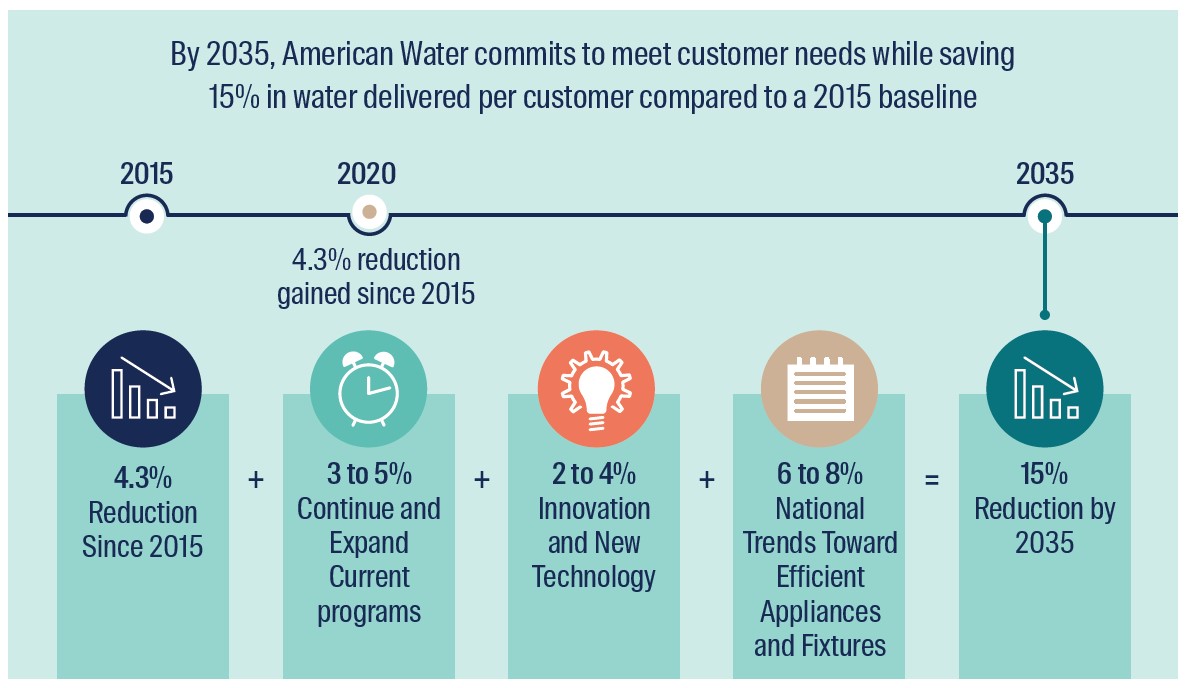
Source: American Water Works. As at 31 August 2021
We believe there is clear data to illustrate that listed water utilities provide substantial environmental and social benefits relative to their government-owned peers.
Conclusion
Listed railroads, electric and water utilities provide their customers with cleaner and greener services than alternative suppliers. The listed infrastructure asset class provides many environmental and social benefits to the customers they serve.
We believe the sustainability benefits of the listed infrastructure asset class are going to be valued more highly in the future by customers, regulators, politicians and investors.
The future for listed infrastructure is bright and sunny
Source: PNM Resources
1 Certain statements, estimates, and projections in this document may be forward-looking statements. These forward-looking statements are based upon First Sentier Investors’ current assumptions and beliefs, in light of currently available information, but involve known and unknown risks and uncertainties. Actual actions or results may differ materially from those discussed. Readers are cautioned not to place undue reliance on these forward-looking statements. There is no certainty that current conditions will last, and First Sentier Investors undertakes no obligation to correct, revise or update information herein, whether as a result of new information, future events or otherwise.
2 US Department of Transportation (2019) as measured by ton miles.
3 Association of American Railroads from Federal Highway Administration data.
4 “The Positive Environmental Effects of Increased Freight by Rail Movements in America” Association of American Railroads 2020.
5 Environmental Protection Agency.
6 For illustrative purposes only. Reference to the names of each company mentioned in this communication is merely for explaining the investment strategy and First Sentier Investors does not necessarily maintain positions in such companies. Any fund or stock mentioned in this presentation does not constitute any offer or inducement to enter into any investment activity nor is it a recommendation to purchase or sell any security.
7 Page 27, CSX Corp 2020 Environmental, Social and Governance Report.
8 Page 7, Norfolk Southern 2021 Environmental, Social and Governance Report.
9 National Safety Council.
10 Bureau of Transportation Statistics within US Department of Transportation. It should be noted that this figure includes ~400 fatalities from trespassers.
11 There are five Federal electric utilities: Tennessee Valley Authority (TVA), Bonneville Power Administration (BPA), Southeastern Power Administration (SEPA), Southwestern Power Administration (SWPA), and Western Area Power Administration (WAPA). TVA is an independent government corporation, while BPA, SEPA, SWPA, and WAPA are separate and distinct entities within the Department of Energy. Starting with BPA in 1937, and followed by SEPA, SWPA, and WAPA, Congress established Power Marketing Administrations (PMAs) to distribute and sell electricity from a network of more than 130 federally-built hydroelectric dams.
12 Public power utilities are not-for-profit utilities that are usually owned by state or local government. These companies include Los Angeles Department of Water & Power, New York Power Authority, CPS Energy, Santee Cooper and Salt River Project.
13 American Public Power Association 2021 Statistical Report.
14 NRECA.
15 Re-Membering the Cooperative Way (John Farrell).
16 American Public Power Association 2021 Statistical Report.
17 America’s Clean Water Crisis Goes Far Beyond Flint. There’s No Relief in Sight. Time Magazine February 2020.
18 When measured by water safety violations.
19 Source: Proceedings of the National Academy of Sciences of the United States of America.
20 “The economic benefits of investing in water” - ASCE.
Important Information
This material is for general information purposes only. It does not constitute investment or financial advice and does not take into account any specific investment objectives, financial situation or needs. This is not an offer to provide asset management services, is not a recommendation or an offer or solicitation to buy, hold or sell any security or to execute any agreement for portfolio management or investment advisory services and this material has not been prepared in connection with any such offer. Before making any investment decision you should conduct your own due diligence and consider your individual investment needs, objectives and financial situation and read the relevant offering documents for details including the risk factors disclosure. Any person who acts upon, or changes their investment position in reliance on, the information contained in these materials does so entirely at their own risk.
We have taken reasonable care to ensure that this material is accurate, current, and complete and fit for its intended purpose and audience as at the date of publication but the information contained in the material may be subject to change thereafter without notice. No assurance is given or liability accepted regarding the accuracy, validity or completeness of this material.
To the extent this material contains any expression of opinion or forward-looking statements, such opinions and statements are based on assumptions, matters and sources believed to be true and reliable at the time of publication only. This material reflects the views of the individual writers only. Those views may change, may not prove to be valid and may not reflect the views of everyone at First Sentier Investors.
Past performance is not indicative of future performance. All investment involves risks and the value of investments and the income from them may go down as well as up and you may not get back your original investment. Actual outcomes or results may differ materially from those discussed. Readers must not place undue reliance on forwardlooking statements as there is no certainty that conditions current at the time of publication will continue.
References to specific securities (if any) are included for the purpose of illustration only and should not be construed as a recommendation to buy or sell the same. Any securities referenced may or may not form part of the holdings of First Sentier Investors’ portfolios at a certain point in time, and the holdings may change over time.
References to comparative benchmarks or indices (if any) are for illustrative and comparison purposes only, may not be available for direct investment, are unmanaged, assume reinvestment of income, and have limitations when used for comparison or other purposes because they may have volatility, credit, or other material characteristics (such as number and types of securities) that are different from the funds managed by First Sentier Investors.
Selling restrictions
Not all First Sentier Investors products are available in all jurisdictions.
This material is neither directed at nor intended to be accessed by persons resident in, or citizens of any country, or types or categories of individual where to allow such access would be unlawful or where it would require any registration, filing, application for any licence or approval or other steps to be taken by First Sentier Investors in order to comply with local laws or regulatory requirements in such country.
This material is intended for ‘professional clients’ (as defined by the UK Financial Conduct Authority, or under MiFID II), ‘wholesale clients’ (as defined under the Corporations Act 2001 (Cth) or Financial Markets Conduct Act 2013 (New Zealand) and ‘professional’ and ‘institutional’ investors as may be defined in the jurisdiction in which the material is received, including Hong Kong, Singapore and the United States, and should not be relied upon by or be passed to other persons.
The First Sentier Investors funds referenced in these materials are not registered for sale in the United States and this document is not an offer for sale of funds to US persons (as such term is used in Regulation S promulgated under the 1933 Act). Fund-specific information has been provided to illustrate First Sentier Investors’ expertise in the strategy. Differences between fund-specific constraints or fees and those of a similarly managed mandate would affect performance results.
About First Sentier Investors
References to ‘we’, ‘us’ or ‘our’ are references to First Sentier Investors, a global asset management business which is ultimately owned by Mitsubishi UFJ Financial Group (MUFG). Certain of our investment teams operate under the trading names FSSA Investment Managers, Stewart Investors and Realindex Investments, all of which are part of the First Sentier Investors group.
This material may not be copied or reproduced in whole or in part, and in any form or by any means circulated without the prior written consent of First Sentier Investors.
We communicate and conduct business through different legal entities in different locations. This material is communicated in:
Australia and New Zealand by First Sentier Investors (Australia) IM Limited, authorised and regulated in Australia by the Australian Securities and Investments Commission (AFSL 289017; ABN 89 114 194311)
European Economic Area by First Sentier Investors (Ireland) Limited, authorised and regulated in Ireland by the Central Bank of Ireland (CBI reg no. C182306; reg office 70 Sir John Rogerson’s Quay, Dublin 2, Ireland; reg company no. 629188)
Hong Kong by First Sentier Investors (Hong Kong) Limited and has not been reviewed by the Securities & Futures Commission in Hong Kong
Singapore by First Sentier Investors (Singapore) (reg company no. 196900420D) and has not been reviewed by the Monetary Authority of Singapore. First Sentier Investors (registration number 53236800B) is a business division of First Sentier Investors (Singapore).
Japan by First Sentier Investors (Japan) Limited, authorised and regulated by the Financial Service Agency (Director of Kanto Local Finance Bureau (Registered Financial Institutions) No.2611)
United Kingdom by First Sentier Investors (UK) Funds Limited, authorised and regulated by the Financial Conduct Authority (reg. no. 2294743; reg office Finsbury Circus House, 15 Finsbury Circus, London EC2M 7EB)
United States by First Sentier Investors (US) LLC, authorised and regulated by the Securities Exchange Commission (RIA 801-93167).
To the extent permitted by law, MUFG and its subsidiaries are not liable for any loss or damage as a result of reliance on any statement or information contained in this document. Neither MUFG nor any of its subsidiaries guarantee the performance of any investment products referred to in this document or the repayment of capital. Any investments referred to are not deposits or other liabilities of MUFG or its subsidiaries, and are subject to investment risk, including loss of income and capital invested.
© First Sentier Investors Group
 |  |
|---|