
Equity markets in 2025 unfolded in ways few investors would describe as familiar. Political uncertainty, abrupt policy shifts and sharp reversals in risk appetite combined with an ongoing surge in technology-led enthusiasm to produce market behaviour that challenged many long-held assumptions. Traditional relationships between risk, valuation and return broke down, leaving even well-established investment styles struggling to behave as expected.
David Walsh’s latest paper explores this extraordinary period in global equity markets, focusing on what sat beneath the headline volatility and why outcomes diverged so sharply from historical experience.
From Risk-Off to Risk-On-and Back Again
2025 was marked by rapid transitions between caution and exuberance. Periods of heightened uncertainty triggered sharp sell-offs, only to be followed by equally powerful rallies as policy fears eased and investor sentiment reversed. These swings are illustrated in the sharp drawdown and recovery of global equity indices over the course of the year (Chart 1).
Chart 1: Cumulative Index Returns: MSCI World and MSCI World (US stocks only) (in AUD)
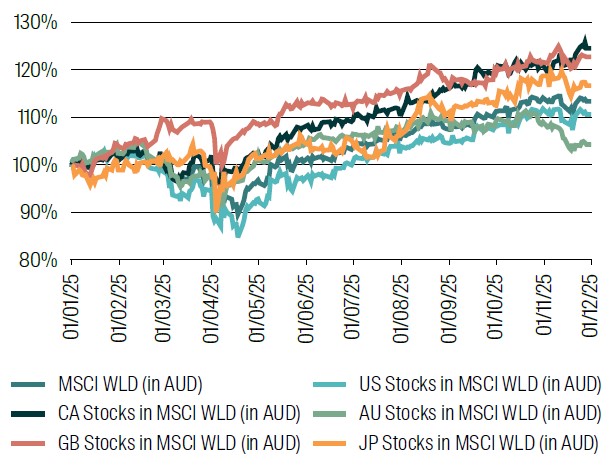
From: 1 January 2025 to 1 December 2025
Source: RQI Investors, MSCI, 2026
These shifts were not evenly distributed across markets. Sector returns before and after key policy inflection points reveal stark differences in performance, particularly between technology, defensive and more cyclical areas of the market (Table 1).
Table 1: Sector returns in US MSCI World stocks – before and after “Liberation Day”
Again, note returns are in AUD, so bottom of the market was actually April 21.
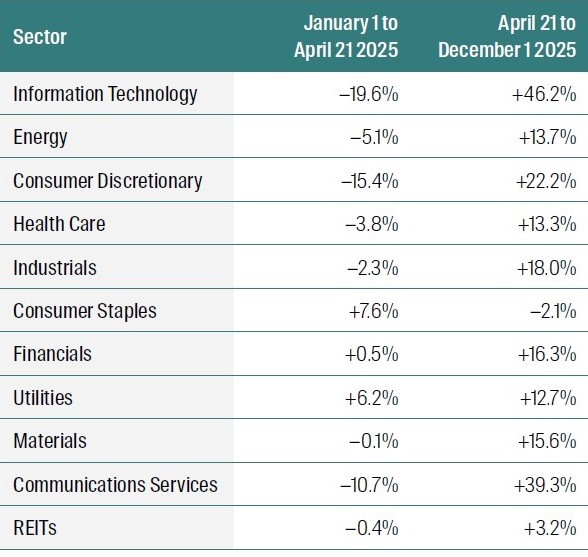
From: 1 January 2025 to 1 December 2025
Source: RQI Investors, MSCI, 2026
Concentration, Shorts and Market Structure
One of the defining features following “Liberation Day” was how strongly returns clustered around particular stocks and characteristics. Technology and communications stocks dominated market leadership, while heavily shorted names and high-beta stocks experienced some of the most dramatic reversals. The rebound in heavily shorted stocks was especially pronounced following the market trough (Chart 2), while the largest technology stocks also played a central role in driving index returns (Table 2).
Table 2: Mag 7 fall and bounce, before and after “Liberation Day”1, plus % short at December 1 20252
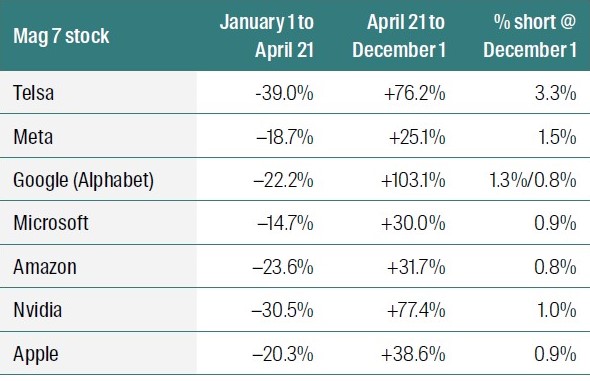
From: 1 January 2025 to 1 December 2025
Source: RQI Investors, MSCI, 2026
When Familiar Factors Stop Behaving Normally
Factor-based investing also faced a challenging environment. Quality, value, size and volatility factors – typically relied upon for diversification and risk management –delivered unexpected outcomes. High-beta stocks underperformed sharply during the sell-off, before dramatically outperforming during the subsequent rally (Chart 3).
Chart 3: Cumulative Returns to 100 highest and 100 lowest beta US Stocks in MSCI World (in AUD), equally weighted
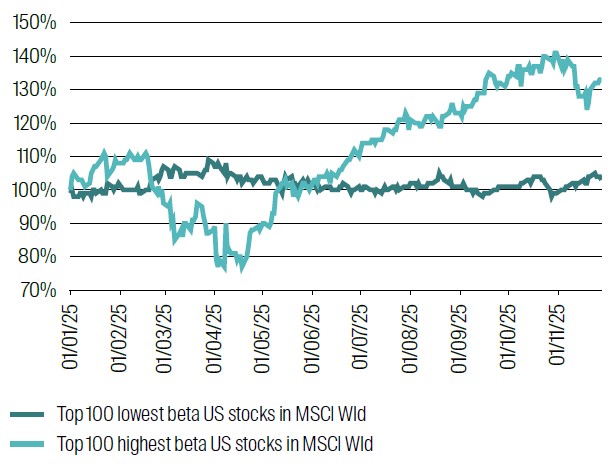
From:1 January 2025 to 1 December 2025
Source: RQI Investors, MSCI, 2026.
Smaller stocks lagged larger peers into the market trough and recovered at a similar pace thereafter (Chart 4), while higher-quality stocks, measured by return on equity, delivered stronger rebounds than lower-quality counterparts (Chart 5). At the same time, expensive stocks significantly outperformed value stocks for much of the year, highlighting the unusual nature of factor returns during this period (Chart 6).
Chart 6: Cumulative Returns to 100 most expensive and 100 best value US stocks in MSCI World (in AUD)
From: 1 January 2025 to 1 December 2025
Source: RQI Investors, MSCI, 2026
Making Sense of an Abnormal Market
Rather than offering prescriptive outcomes or forecasts, Far From Normal provides a framework for understanding why markets behaved as they did by breaking the year into its underlying drivers and examining how policy uncertainty, investor positioning and market structure combined to produce outcomes that were far removed from historical norms.
Explore the full article to understand what made 2025 far from normal, and how these dynamics can inform interpretation of recent market behaviour across different regions, sectors and investment styles.
RQI Investors
We combine powerful quantitative analysis with human insight, aiming to deliver strong investment performance
Our proprietary quantitative equities approach is founded on proven data combined with the disciplined application of meaningful economic fundamentals that aims to enhance investment performance.
1 Yes, Google has had a greater than 100% return since April 21.
2 Reference to specific securities (if any) is included for the purpose of illustration only and should not be construed as a recommendation to buy or sell the same. All securities mentioned herein may or may not form part of the holdings of RQI Investors’ portfolios at a certain point in time, and the holdings may change over time.
Explore our latest insights
Important Information
This material is for general information purposes only. It does not constitute investment or financial advice and does not take into account any specific investment objectives, financial situation or needs. This is not an offer to provide asset management services, is not a recommendation or an offer or solicitation to buy, hold or sell any security or to execute any agreement for portfolio management or investment advisory services and this material has not been prepared in connection with any such offer. Before making any investment decision you should consider, with the assistance of a financial advisor, your individual investment needs, objectives and financial situation.
We have taken reasonable care to ensure that this material is accurate, current, and complete and fit for its intended purpose and audience as at the date of publication. No assurance is given or liability accepted regarding the accuracy, validity or completeness of this material and we do not undertake to update it in future if circumstances change.
To the extent this material contains any expression of opinion or forward‑looking statements, such opinions and statements are based on assumptions, matters and sources believed to be true and reliable at the time of publication only. This material reflects the views of the individual writers only. Those views may change, may not prove to be valid and may not reflect the views of everyone at First Sentier Group.
About First Sentier Group
References to ‘we’, ‘us’ or ‘our’ are references to First Sentier Group, a global asset management business which is ultimately owned by Mitsubishi UFJ Financial Group. Certain of our investment teams operate under the trading names AlbaCore Capital Group, First Sentier Investors, FSSA Investment Managers, Stewart Investors, RQI Investors and Igneo Infrastructure Partners, all of which are part of the First Sentier Group. RQI branded strategies, investment products and services are not available in Germany.
We communicate and conduct business through different legal entities in different locations. This material is communicated in:
- Australia and New Zealand by First Sentier Investors (Australia) IM Ltd, authorised and regulated in Australia by the Australian Securities and Investments Commission (AFSL 289017; ABN 89 114 194311)
- European Economic Area by First Sentier Investors (Ireland) Limited, authorised and regulated in Ireland by the Central Bank of Ireland (CBI reg no. C182306; reg office 70 Sir John Rogerson’s Quay, Dublin 2, Ireland; reg company no. 629188)
- Hong Kong by First Sentier Investors (Hong Kong) Limited and has not been reviewed by the Securities & Futures Commission in Hong Kong. First Sentier Group, First Sentier Investors, FSSA Investment Managers, Stewart Investors, RQI Investors and Igneo Infrastructure Partners are the business names of First Sentier Investors (Hong Kong) Limited.
- Singapore by First Sentier Investors (Singapore) (reg company no. 196900420D) and this advertisement or material has not been reviewed by the Monetary Authority of Singapore. First Sentier Group (registration number 53507290B), First Sentier Investors (registration number 53236800B), FSSA Investment Managers (registration number 53314080C), Stewart Investors (registration number 53310114W), RQI Investors (registration number 53472532E) and Igneo Infrastructure Partners (registration number 53447928J) are the business names of First Sentier Investors (Singapore).
- United Kingdom by First Sentier Investors (UK) Funds Limited, authorised and regulated by the Financial Conduct Authority (reg. no. 2294743; reg office Finsbury Circus House, 15 Finsbury Circus, London EC2M 7EB)
- United States by First Sentier Investors (US) LLC, registered with the Securities Exchange Commission (SEC# 801‑93167)
- other jurisdictions, where this document may lawfully be issued, by First Sentier Investors International IM Limited, authorised and regulated in the UK by the Financial Conduct Authority (FCA ref no. 122512; Registered office: 23 St. Andrew Square, Edinburgh, EH2 1BB; Company no. SC079063).
To the extent permitted by law, MUFG and its subsidiaries are not liable for any loss or damage as a result of reliance on any statement or information contained in this document. Neither MUFG nor any of its subsidiaries guarantee the performance of any investment products referred to in this document or the repayment of capital. Any investments referred to are not deposits or other liabilities of MUFG or its subsidiaries, and are subject to investment risk, including loss of income and capital invested.
© First Sentier Group 2026
