- Freight rail service metrics are improving but volumes remain soft, driven by retail destocking and weak demand
- Competitive pressures are mounting on US West Coast and Canadian rail networks, following the CPKC1 merger
- US water utility privatisations are increasing in frequency and size, to the benefit of earnings growth
- Recent action by the US Congress has been supportive of energy infrastructure, particularly the need for natural gas as a reliable transition fuel
- We expect further consolidation within the energy midstream sector, although the OKE-MMP2 mega-merger makes little strategic sense to us
We recently spent a couple of weeks in the US and Canada, meeting with management teams from the railroads, utilities and energy midstream sectors, as well as with regulators. Below are some of our findings. We hope you find them interesting.
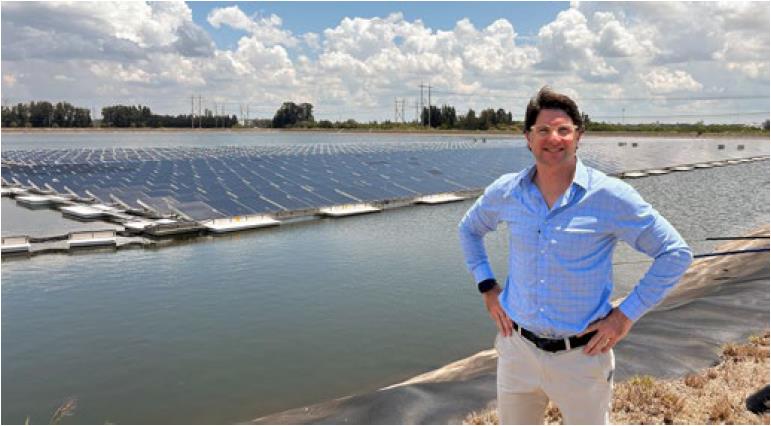
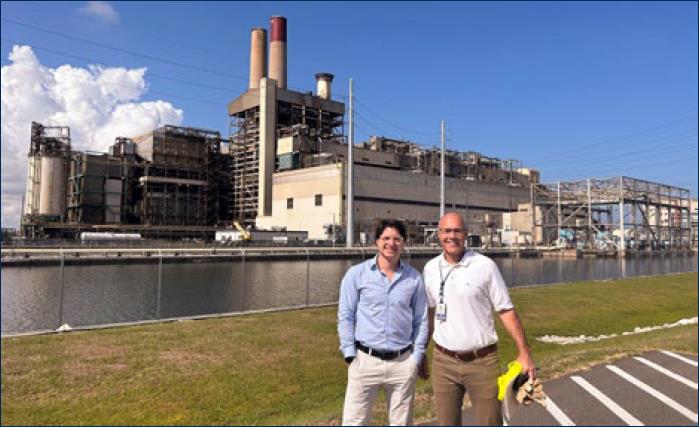
Emera’s 1MW3 floating solar pilot project in Tampa, FL
Source: First Sentier Investors
Railroads
On the US East Coast we met with North American Class I4 railroads. Key themes in these meetings included the expected low point of the current freight cycle, with downside risk to June quarter earnings; an increasing focus on customers and employees; improving service metrics; and the changing competitive dynamics between operators in the US West Coast and Canada. Fundamentals are mixed, with weak volumes being partly offset by strong pricing and improving service levels.
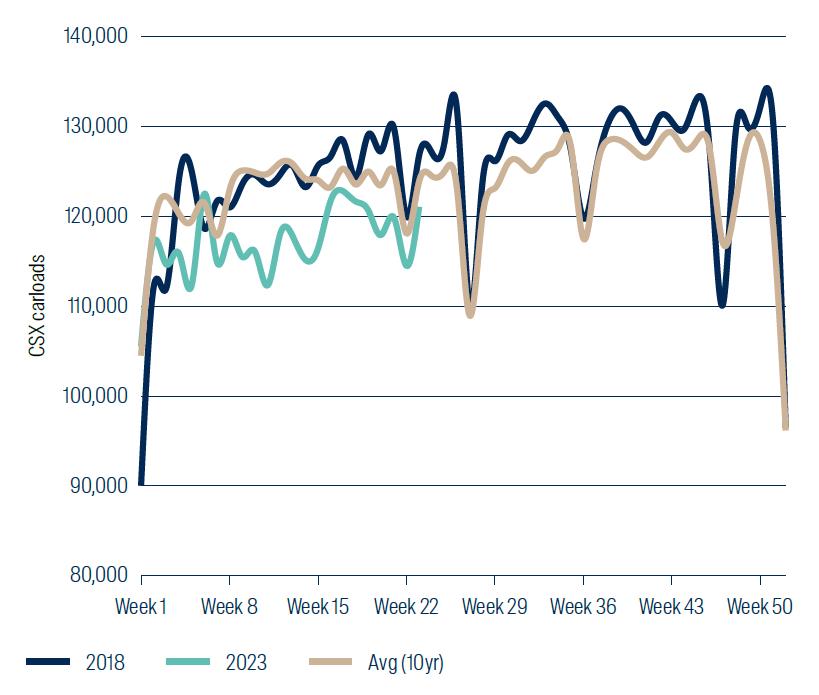
Freight volumes have continued to disappoint during the June quarter. Most of the rail and trucking companies we met with pointed to signs of stabilisation but no recovery yet – and so the freight recession continues. This has largely been driven by weaker intermodal5 volumes.This segment accounts for roughly 50% of East Coast US railroad (CSX Corp and Norfolk Southern6) volumes but only 15–20% of revenues. Conversely, auto, coal and grain volumes have surpassed expectations. Given the higher pricing that these segments command, this should result in a positive pricing mix.
CSX volumes compared to pre-pandemic and 10-yr average
Source: First Sentier Investors, CSX Corp as at 11 June 2023
We also met with management from the Port of Los Angeles, who struck an optimistic tone despite volumes at the port being 30% lower than this time a year ago (20% owing to macroeconomic headwinds/10% owing to market share loss to the East Coast ports). Lower West Coast port volumes reflect current nearshoring/onshoring trends and customers seeking to diversify to other ports, given ongoing West Coast port union negotiations. While we expect these trends to continue, the risks are now better reflected in market expectations.
Rail service metrics have materially improved from a year ago, with Canadian Pacific Railway, Canadian National Railway and CSX Corp leading the pack. West Coast operators Union Pacific and BNSF (part of the Berkshire Hathaway conglomerate) are still being called out as having labour shortage issues and “unacceptable service” (in the STB’s7 words). Improving service metrics in January by Norfolk Southern have since reversed, given the derailment in East Palestine, Ohio in February this year, but are expected to get better again from early July. Overall, service metrics must improve further for volumes to grow and to support railroad market share gains from trucks over the longer term.
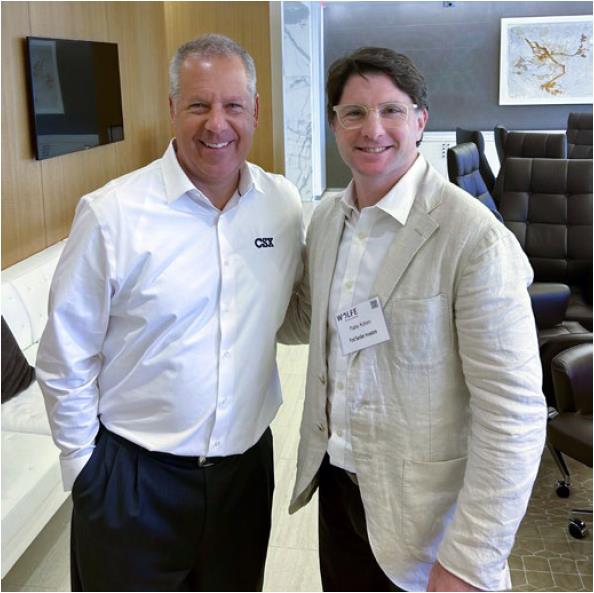
Pablo Kohen (FSI) with Joe Hinrichs, new CSX CEO
Source: First Sentier Investors, May 2023
In the past 18 months, five of the seven Class I railroads have appointed new CEOs. We have observed a shift from this role being held by operational railroaders, towards more customer and employee focussed CEOs. For example, CSX Corp’s recently-appointed CEO Joe Hinrichs previously worked for Ford, and has no prior railroading experience.
This coincides with a shift in earnings growth drivers for the industry. Over the last twenty years, margins for the industry have improved by over 30%8, as operationally focused leaders have achieved substantial productivity gains. The emphasis is now moving away from cost reduction/productivity improvements, and towards service standards and volume growth.
The North American freight rail sector expects to maintain double-digit EPS9 growth rates. Share buybacks and the ability to raise prices by more than (rail cost) inflation will continue to be key. Margin expansion will represent a smaller component of earnings growth and volume growth will become more significant. We think volume growth can be realised through consistent service metrics, nearshoring/onshoring, and a growing recognition of the sustainability benefits that freight rail has over trucking. However, management will have less control over volumes in the future than the operating efficiencies achieved in the past under Precision Scheduled Railroading (PSR).
These industry growth drivers were emphasized by our meetings with Marty Oberman, STB Chairman since 2021, and Michelle Schultz, an STB board member since 2021. The STB takes a light-handed approach to regulation of the railroad industry. It is primarily involved in resolving shipper disputes but more recently played a central role in approving the merger between Canadian Pacific and Kansas City Southern (CPKC), on the grounds that it was likely to improve railroad competition. Overall, we found the STB’s tone at our meetings to be more positive than it had been a year ago. They cited huge improvements in hiring and service over the last 12 months.
Since the CPKC deal closed in April 2023, the new combined entity already has announced multi-year agreements allowing US logistics firms Schneider and Knight-Swift to use its newly combined North-South rail corridor connecting Mexico, US and Canada. Soon after this announcement, Canadian National announced Falcon Premium – a similar Canada-US-Mexico rail service partnering with Union Pacific and Mexican operator Ferromex. Falcon boasts the shortest and most direct routes into Mexico, whereas CPKC argues that their premium service and lack of interchange will see a faster transit time. These announcements came within two weeks of the historic deal closing. Perhaps the STB was right about increased competition.
Water utilities
We travelled to Philadelphia, home to the two largest listed water utilities by market capitalisation10 – Essential Utilities and American Water Works. These two companies are part of a unique industry that is currently seeing an increasing number of privatisations, owing to a number of factors that were discussed during this trip and that are explored below.
First, the US water industry remains highly fragmented. The US Environmental Protection Agency (EPA) estimates that, as of 2017, the US contained around 50,000 water and 15,000 wastewater systems. This compares with around 2,000 gas utilities11 and 3,800 electric utilities12 in the US. The EPA also estimates that around 85% of these water and wastewater systems are owned by municipalities – prime characteristics for consolidation.
We believe that M&A activity can add between 1% and 2% per annum EPS growth to the water utilities sub-sector over time. The resulting above-industry-average earnings growth, alongside a lower risk profile, is partly why water utilities trade at a premium to electric and gas utilities.
A second supportive factor of privatisations within this space is Fair Market Value (FMV) legislation. First seen in Illinois in 2013, this has now spread to 12 states across the US13. FMV allows a listed company, such as Essential Utilities or American Water Works, to purchase a water municipality and to rate base the purchase price without having to incur goodwill on their balance sheet. This allows the purchaser to earn a Return on Equity of between 9% and 10% on the total purchase price – a very attractive use of capital that is unique to the purchase of water utilities.
A further two additional factors have arisen in the last year, which we think will accelerate privatisations.
First, higher interest rates are placing increasing pressure on municipalities to sell their water systems. Water-related capital investment commitments are growing and becoming harder for municipal governments to meet. Meanwhile municipal bond yields have risen from 2% to between 5% and 6%14 over the last year, while inflation is putting upward pressure on the cost of pipes, chemicals, fuel and labour. Against this backdrop, customers can either stay with their independent/municipal water provider, and face likely rate increases of up to 20%; or the municipal government can sell the water or wastewater assets, allowing the cost and capex requirements to be spread across a much larger customer base.
US utilities by water, electric and gas
Water utilities

Natural gas utilities
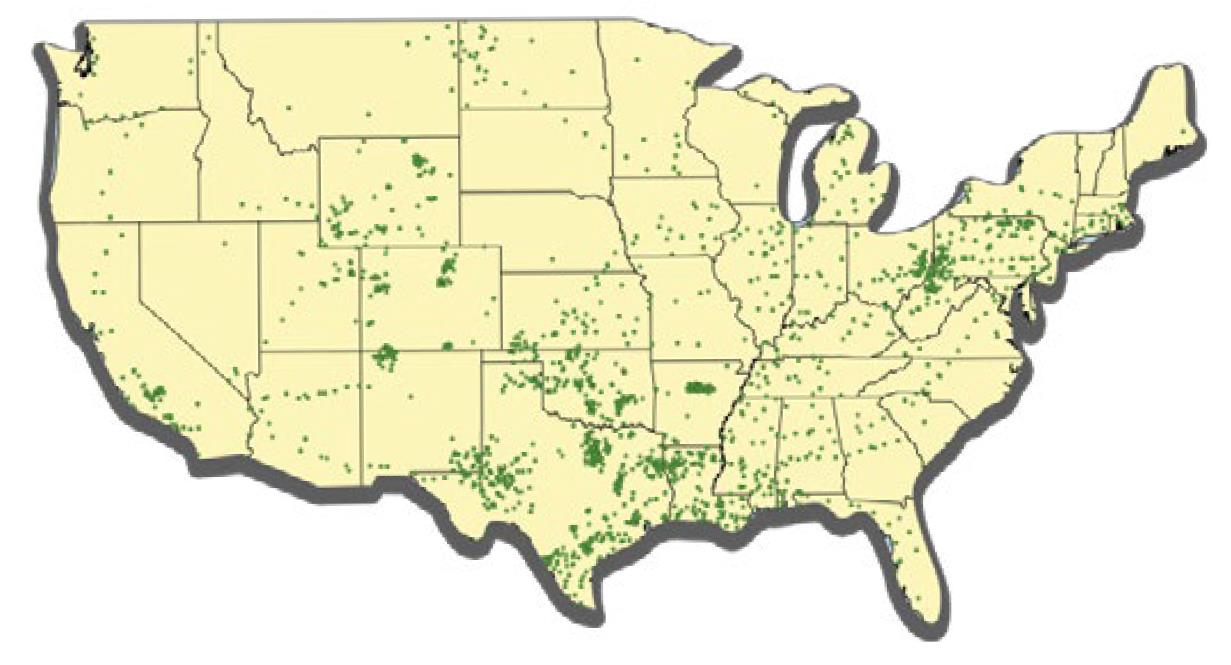
Electric utilities
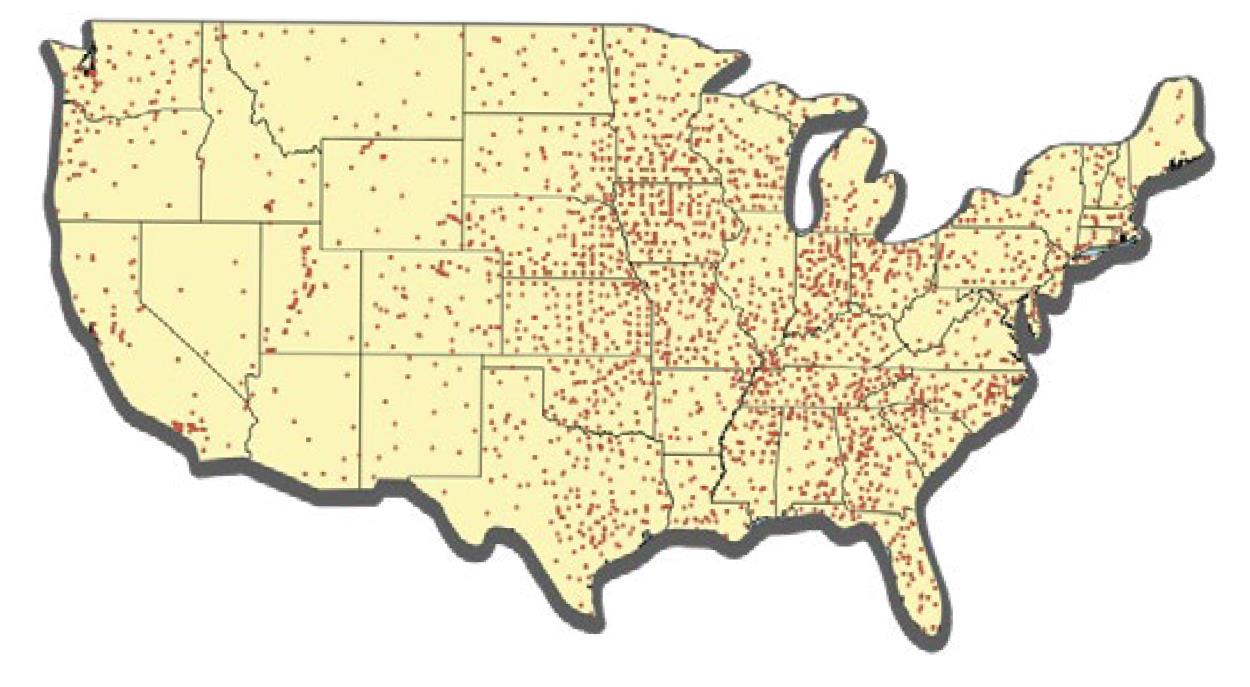
Water utilities source: EPA SDWIS Federal Reports Search www3.epa.gov/enviro/facts/sdwis
Electric utilities source: Form EIA-861 detailed data files www.eia.gov/electricity/data/eia8
Gas utilities source: EPA F.L.I.G.H.T. Greenhouse Gas Emissions from Large Facilities Ghgdata.epa.gov/ghgp/main.do#
Recently, we have observed an increase in the number of wastewater rather than water asset sale announcements. We think this is because it is less politically sensitive for a municipality to sell its sewage assets than its water assets. Both assets are treated the same under FMV legislation and the water utilities say they are agnostic to which they acquire, often finding that a wastewater sale can eventually lead to a water sale years later.
Second, in March 2023 the EPA proposed new regulations which would see maximum allowed PFAS15 contamination levels reduced to 4 parts per trillion, from the range of levels (varying by state) that are allowed today. In the same month, the EPA estimated that the total cost for compliance across the country to be between $770 million and $1.2 billion – a number that industry experts and the investor owned utilities say vastly under-estimates the true cost. Many municipalities do not even have the testing capabilities today, let alone the treatment facilities that would need to be built out in order to meet this requirement. These regulations threaten to add further financial pressure to municipalities that are already under strain with higher inflation and interest rates, further encouraging sales to larger investor-owned utilities.
Value of M&A in the US water utilities sector, by year
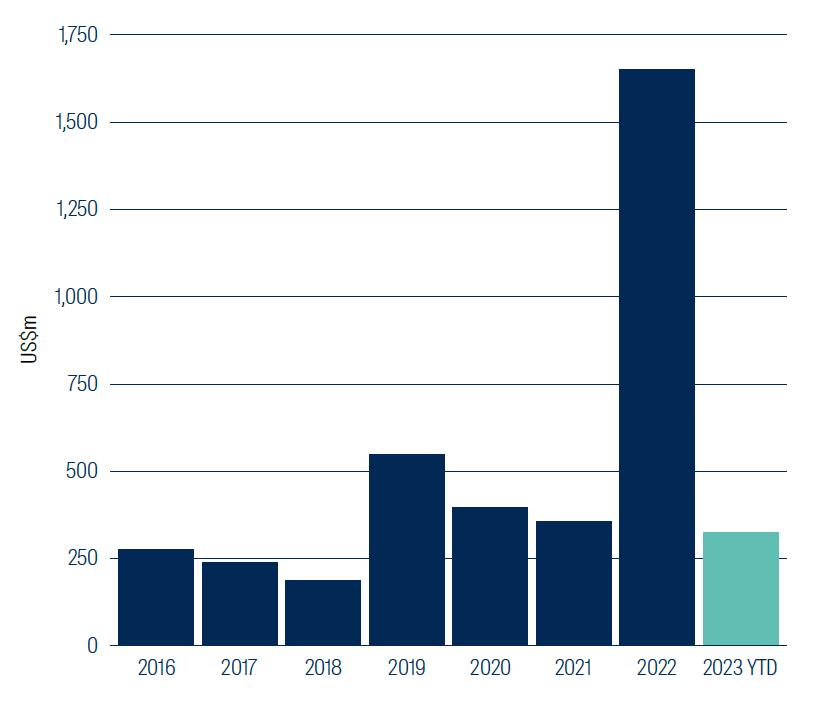
Source: First Sentier Investors as at 31 May 2023
To summarise: municipalities are increasingly pressured to sell their water and wastewater systems given the huge investment needed to maintain ageing infrastructure and meet potential new EPA regulations, at a time that financing costs and inflation have gone up. FMV legislation allows listed infrastructure companies to buy these companies at 1x rate base and support their longer term EPS growth targets – a unique attribute in this industry.
Energy Midstream
We attended an Energy Midstream conference where the recently announced mega-merger between ONEOK (OKE) and Magellan Midstream Partners (MMP) was front-of-mind in every meeting. At US$19 billion, OKE’s bid for MMP is much larger than other recent transactions. With parts of the energy midstream sector now approaching structural decline, some midstream companies are taking non-traditional paths (and additional risks) in order to grow. This deal, which seems to be mainly premised on capturing the tax benefits embedded in a MLP tax structure19, appears to be an example of this.
Most management teams we heard from were sceptical of this transaction, noting that acquisitions should be premised on clear strategic and competitive benefits, not just cost synergies and tax gains. We struggle to understand the strategic rationale for combining OKE, a Natural Gas Liquids midstream service provider that has a dominant competitive position in the Bakken basin, with MMP, the operator of a refined products transportation network running through the central US.
However, with higher capex inflation and stronger balance sheets after several years of painful restructuring, we expect further consolidation within this space. There are still 64 listed energy midstream companies (of which 42 are MLPs20 and 22 are C-Corps) including ~20 that have a market capitalisation of less than US$1 billion. The industry remains fragmented, with many privately held assets that could be run more efficiently within larger platforms. Scale matters for this sector.
The natural gas supply / demand outlook was also a key topic during company meetings. The combination of one of the warmest Northern Hemisphere winters on record alongside increasing gas supply has seen prices fall. Producers are reacting by reducing rig counts and slashing capex budgets.
DT Midstream (DTM) owns gathering, processing and pipeline assets in the Texas / Louisiana Haynesville basin. Production levels from this predominantly natural gas basin have grown strongly (at a ~13% Compound Annual Growth Rate over the past five years, shown in the following chart). This has been driven by demand from new natural gas power plants and Liquefied Natural Gas (LNG) export facilities on the US Gulf Coast. DTM management expressed confidence that current volume and earnings guidance were still achievable, despite the headwind of lower natural gas prices. The terms of its contracts with customers limit the company’s exposure to underlying commodity prices.
Gas volume growth and production levels: Haynesville
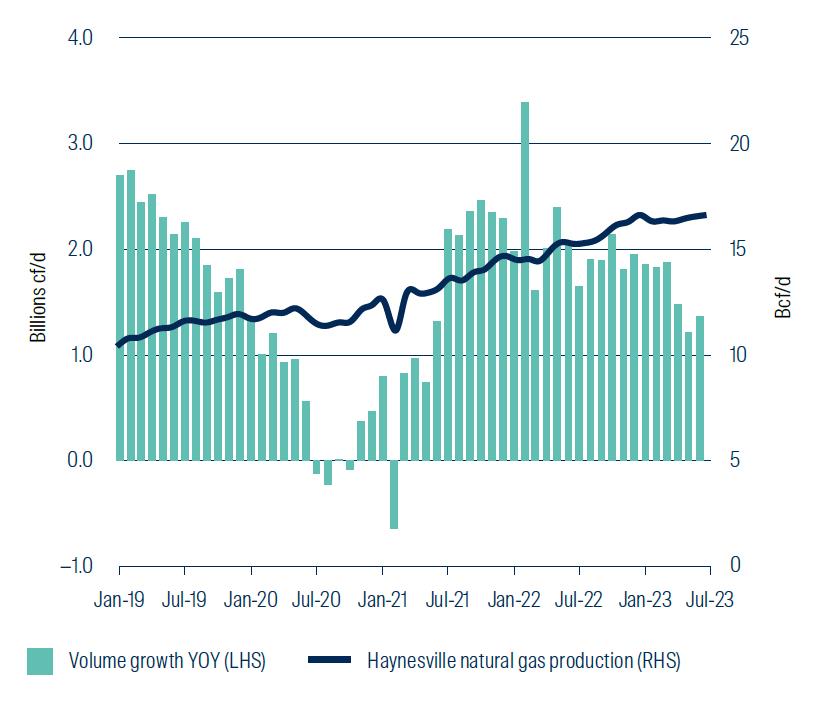
Source: First Sentier Investors, US Department of Energy Drilling Productivity Report as at 31 May 2023
The trip also provided further reminders of a robust demand outlook for natural gas. In recent years, much emphasis has been placed on growth in renewables and other forms of carbon free energy. We have taken the view that while large-scale renewables investment is inevitable and necessary, natural gas also has a crucial role to play as a transition fuel.
An upcoming wave of new LNG export facilities supports this perspective. Six additional LNG projects are currently being built in the US Gulf Coast region21. Together, these will add a further ~11 bcf/d22 of natural gas demand, with the Haynesville and Texas’ Permian basins best positioned to meet it. The following chart illustrates the forecast growth of US LNG export facilities over coming years. While these facilities may not all be built, the growth potential in this space remains considerable.
US LNG export facilities (current, under construction and potential)
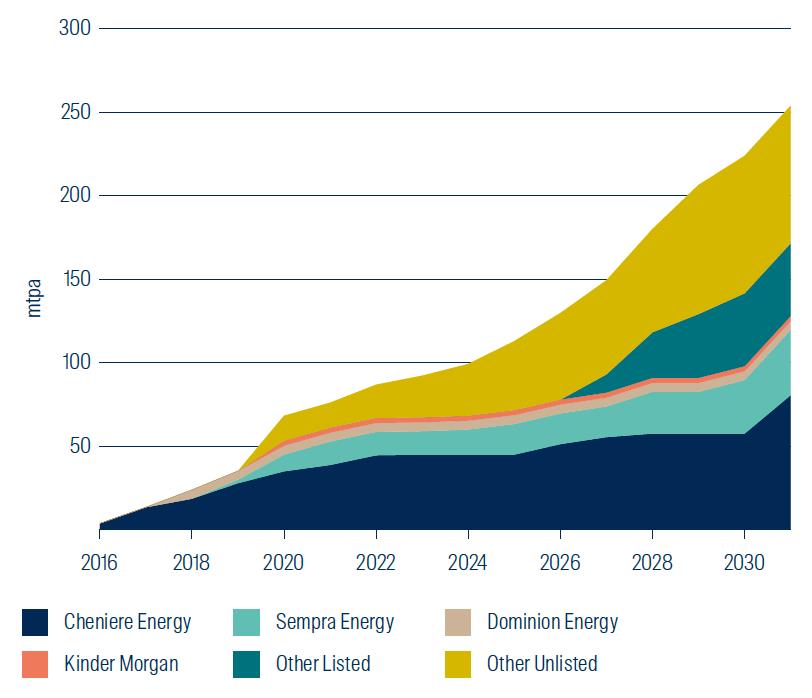
Source: First Sentier Investors as at 30 June 2023
Energy midstream companies remain focused on healthy balance sheets and sensible capital allocation policies. Examples include funding capex from internal cash flows, ensuring that dividend payout ratios remain at sustainable levels, and using excess cash flows to fund share buybacks – which are now commonplace within this space. Of the companies we cover, the following have share buyback programs in place: Targa Resources, Cheniere Energy, Kinder Morgan, Williams, Enbridge Inc. and Enterprise Products Partners.
During our trip, we learnt that the recently enacted Fiscal Responsibility Act of 2023 includes provisions to speed up the approval process of the Mountain Valley Pipeline (MVP)23 project. This 304-mile pipeline running between West Virginia and Virginia has been held up by legal challenges. It represents a prime example of how difficult it had become to build new energy infrastructure in the US, despite being 94% complete. The new law removes the need for a judicial review of the federal permits needed to proceed with MVP – effectively allowing construction to resume.
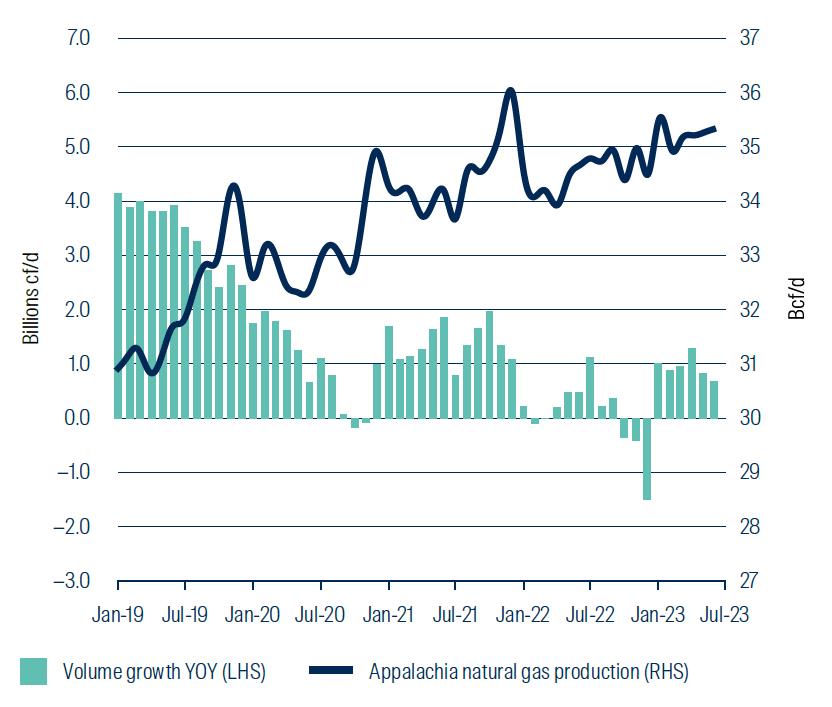
MVP will add an extra 2bcf/d of natural gas takeaway capacity from the Appalachian region, and should drive volume growth out of the massive and low-cost Marcellus natural gas basin. Following a period of strong growth prior to 2020, this basin has seen almost flat volumes in recent years (illustrated in the chart below) owing to insufficient pipeline infrastructure in the region. The completion of MVP is expected to benefit energy midstream operators in the region, including Equitrans Midstream, Williams, DT Midstream, UGI Corp and AltaGas.
Gas volume growth and production levels: Appalachia
Source: First Sentier Investors, US Department of Energy Drilling Productivity Report as at 31 May 2023
We noticed a clear contrast to last time we travelled, when company management holding group meetings faced numerous questions from investors on Environmental, Social and Governance (ESG) issues. This time, there were none. ESG has been a priority for our team since the inception of our strategy in 2007, and remains so. Key issues we have discussed recently with North American energy midstream and railroad companies include employee satisfaction/engagement levels; remuneration frameworks; energy transition strategies and Board composition.
Travel companions
Reading by Pablo: with so many flights and so much airport time, business travel is a great time to catch up on my reading.
“Chip War” by Chris Miller is an excellent book to understand the history and future of a key component of today’s technology; “…No product is more central to international trade than semiconductors”.
“A History of Spain” by Arturo Pérez-Reverte, one of my favourite fiction writers, has now produced a no-holds barred account of Spanish history. His depiction of its kings and queens is nothing short of astounding.
Listening by Pablo: DJ Hernán Cattáneo, the doyen of progressive house.
Watching by Jessica: “The Last of Us” – love a good zombie apolocalypse to offer some life perspective.
Listening by Jessica: Kiwi band Six60 to try and chill after many flight delays, a welcome reprieve from Disney’s Frozen that I have to listen to daily at home.
Conclusion
This was a timely trip, coming just one week after energy midstream M&A activity, US Congress support for energy infrastructure, a sharp slowdown in freight volumes and historical water utility regulation proposals from the EPA. Our meetings provided lots of interesting conversations, useful insights and fresh research opportunities.
We believe that North American listed infrastructure companies remain attractive long-term investment opportunities – and the pullback in valuations seen in 2023 gives an excellent entry point into these high quality companies.
Footnotes
1 Canadian Pacific Kansas City
2 ONEOK/Magellan Midstream Partners merger announced in May 2023
3 Megawatt
4 Railroads that operate in the US are assigned to Class I, II or III according to annual revenue criteria, with Class I being the largest
5 A way of transporting goods within containers that allows a seamless transfer along the route between trains, trucks, and cargo ships
6 The stocks mentioned in this paper may be current or former holdings of the portfolios managed by the listed infrastructure investment team at First Sentier Investors
7 The Surface Transportation Board is the US freight rail regulator
8 Source: First Sentier Investors, company reports. As at 30 June 2023
9 Earnings per Share
10 Source: Bloomberg. As at 30 June 2023
11 Source: US Energy Information Administration as at 31 July 2020.
12 Source: Statista as at 8 February 2023.
13 California, Iowa, Illinois, Indiana, Maryland, Missouri, New Jersey, North Carolina, Ohio, Pennsylvania, Texas, Virginia
14 Bloomberg data
15 PFAS stands for Perfluoroalkyl and Polyfluoroalkyl Substances. These are chemicals produced in the US since the 1940s and could be thought of as “microplastics” also known as “forever chemicals”
16 Combined Cycle Gas Turbine
17 Data from company reports
18 Gigawatt hours
19 MMP assets are held within a MLP structure, whereas OKE is a C-Corp. The Inflation Reduction Act (IRA) includes tax changes that will accelerate the payment of cash tax, with many C-Corps seeing cash tax expense increasing sooner than previously expected. There is another tax angle from the perspective of MMP unitholders. Lower capital expenditure levels in the energy midstream space have reduced the ability of these companies to reduce their taxable income. As energy midstream companies have reduced capex, relative to historical averages, the amount of accelerated depreciation bonuses have also fallen. In addition, healthier balance sheets (ie lower leverage) imply lower interest expenses.
20 These entities operate across a range of different categories, including liquid products, minerals, LNG, shipping, refinery logistics, coal, propane, oilfield services, diversified and others
21 These include NextDecade Rio Grande LNG, Golden Pass LNG, Corpus Christi Stage III, Plaquemines Phase I and II and Port Arthur Phase I.
22 Billion cubic feet per day
23 MVP is owned by Equitrans Midstream, Nextera Energy, Consolidated Edison, AltaGas and RGC Midstream. Construction started in 1Q18 with an original completion date of 4Q18 and a total cost of $3.25 billion. Due to subsequent permitting issues and legal disputes, the construction has stalled while its total cost has ballooned to $6.6 billion. Equitrans, the pipeline operator, now expects completion by the end of 2023/early 2024.
Global listed infrastructure insights
Important information
This material is for general information purposes only. It does not constitute investment or financial advice and does not take into account any specific investment objectives, financial situation or needs. This is not an offer to provide asset management services, is not a recommendation or an offer or solicitation to buy, hold or sell any security or to execute any agreement for portfolio management or investment advisory services and this material has not been prepared in connection with any such offer. Before making any investment decision you should conduct your own due diligence and consider your individual investment needs, objectives and financial situation and read the relevant offering documents for details including the risk factors disclosure.
Any person who acts upon, or changes their investment position in reliance on, the information contained in these materials does so entirely at their own risk.
We have taken reasonable care to ensure that this material is accurate, current, and complete and fit for its intended purpose and audience as at the date of publication. No assurance is given or liability accepted regarding the accuracy, validity or completeness of this material.
To the extent this material contains any expression of opinion or forward-looking statements, such opinions and statements are based on assumptions, matters and sources believed to be true and reliable at the time of publication only. This material reflects the views of the individual writers only. Those views may change, may not prove to be valid and may not reflect the views of everyone at First Sentier Investors.
Past performance is not indicative of future performance. All investment involves risks and the value of investments and the income from them may go down as well as up and you may not get back your original investment. Actual outcomes or results may differ materially from those discussed. Readers must not place undue reliance on forward-looking statements as there is no certainty that conditions current at the time of publication will continue.
References to specific securities (if any) are included for the purpose of illustration only and should not be construed as a recommendation to buy or sell the same. Any securities referenced may or may not form part of the holdings of First Sentier Investors' portfolios at a certain point in time, and the holdings may change over time.
References to comparative benchmarks or indices (if any) are for illustrative and comparison purposes only, may not be available for direct investment, are unmanaged, assume reinvestment of income, and have limitations when used for comparison or other purposes because they may have volatility, credit, or other material characteristics (such as number and types of securities) that are different from the funds managed by First Sentier Investors.
Selling restrictions
Not all First Sentier Investors products are available in all jurisdictions.
This material is neither directed at nor intended to be accessed by persons resident in, or citizens of any country, or types or categories of individual where to allow such access would be unlawful or where it would require any registration, filing, application for any licence or approval or other steps to be taken by First Sentier Investors in order to comply with local laws or regulatory requirements in such country.
This material is intended for ‘professional clients’ (as defined by the UK Financial Conduct Authority, or under MiFID II), ‘wholesale clients’ (as defined under the Corporations Act 2001 (Cth) or Financial Markets Conduct Act 2013 (New Zealand) and ‘professional’ and ‘institutional’ investors as may be defined in the jurisdiction in which the material is received, including Hong Kong, Singapore, Japan, and the United States, and should not be relied upon by or be passed to other persons.
The First Sentier Investors funds referenced in these materials are not registered for sale in the United States and this document is not an offer for sale of funds to US persons (as such term is used in Regulation Spromulgated under the 1933 Act). Fund-specific information has been provided to illustrate First Sentier Investors’ expertise in the strategy. Differences between fund-specific constraints or fees and those of a similarly managed mandate would affect performance results.
About First Sentier Investors
References to ‘we’, ‘us’ or ‘our’ are references to First Sentier Investors, a global asset management business which is ultimately owned by Mitsubishi UFJ Financial Group (MUFG). Certain of our investment teams operate under the trading names FSSA Investment Managers, Stewart Investors and Realindex Investments, all of which are part of the First Sentier Investors group.
This material may not be copied or reproduced in whole or in part, and in any form or by any means circulated without the prior written consent of First Sentier Investors.
We communicate and conduct business through different legal entities in different locations. This material is communicated in:
- Australia and New Zealand by First Sentier Investors (Australia) IM Ltd, authorised and regulated in Australia by the Australian Securities and Investments Commission (AFSL 289017; ABN 89 114 194311)
- European Economic Area by First Sentier Investors (Ireland) Limited, authorised and regulated in Ireland by the Central Bank of Ireland (CBI reg no. C182306; reg office 70 Sir John Rogerson’s Quay, Dublin 2, Ireland; reg company no. 629188)
- Hong Kong by First Sentier Investors (Hong Kong) Limited and has not been reviewed by the Securities & Futures Commission in Hong Kong. First Sentier Investors, FSSA Investment Managers and Stewart Investors are the business names of First Sentier Investors (Hong Kong) Limited.
- Singapore by First Sentier Investors (Singapore) (reg company no. 196900420D) and this advertisement or material has not been reviewed by the Monetary Authority of Singapore. First Sentier Investors (registration number 53236800B), FSSA Investment Managers (registration number 53314080C) and Stewart Investors (registration number 53310114W) are the business divisions of First Sentier Investors (Singapore).
- United Kingdom by First Sentier Investors (UK) Funds Limited, authorised and regulated by the Financial Conduct Authority (reg. no. 2294743; reg office Finsbury Circus House, 15 Finsbury Circus, London EC2M 7EB)
- United States by First Sentier Investors (US) LLC, authorised and regulated by the Securities Exchange Commission (RIA 801-93167).
- Other jurisdictions, where this document may lawfully be issued, by First Sentier Investors International IM Limited, authorised and regulated in the UK by the Financial Conduct Authority (FCA ref no. 122512; Registered office: 23 St. Andrew Square, Edinburgh, EH2 1BB; Company no. SC079063).
To the extent permitted by law, MUFG and its subsidiaries are not liable for any loss or damage as a result of reliance on any statement or information contained in this document. Neither MUFG nor any of its subsidiaries guarantee the performance of any investment products referred to in this document or the repayment of capital. Any investments referred to are not deposits or other liabilities of MUFG or its subsidiaries, and are subject to investment risk, including loss of income and capital invested.
© First Sentier Investors Group
Get the right experience for you
Your location :  Luxembourg
Australia & NZ
-
 Australia
 -
 New Zealand
Asia
-
 Hong Kong (English)
 -
 Hong Kong (Chinese)
 -
 Singapore
 -
 Japan
Japan


 United Kingdom