
Global Listed Infrastructure has delivered dividend yields between 3-4% per annum consistently for over 20 years.
GLI dividends are forecast to grow 5-6% p.a. from a combination of healthy demand, pricing power, and increasing payout ratios.
After a period of hiatus, share buybacks are back on the agenda for progressive boards and will play an integral role in shareholder returns.
GLI dividend yields attractive in absolute terms and relative to history
For over twenty years, the global listed infrastructure asset class (GLI) has consistently generated dividend yields in the 3%-4% range. As valuation multiples have declined in the past few years, dividend yields have expanded into the upper half of this range.
The sustainability of these returns remains underpinned by stable demand for infrastructure, established cash-generative business models and sensible dividend payout ratios1. With the US and UK economies expecting further interest rate reductions in 2026, this should support the appeal of GLI dividend yields going forward.
Dividends have ample scope to grow (not fixed coupons)
Whilst the headline dividend yield is attractive, the more exciting aspect is that rather than remaining fixed, like most bond coupons, asset class dividends have scope to grow over time. There are multiple facets to dividend growth: organic earnings growth (including inflation-linkage), increasing payout ratios, and the possibility of special dividend payments.
Organic earnings growth
The First Sentier Investors Global Listed Infrastructure team’s definition of infrastructure includes sustainable growth alongside pricing power, high barriers to entry and predictable cash flow. The ability to grow earnings steadily over time, with less sensitivity than general equities to the broader economic cycle, is a key characteristic of GLI and one that we find most compelling about the asset class.
Growing demand for infrastructure services comes from myriad sources; electricity network upgrades for electrification and decarbonisation, exponential growth in power demand from artificial intelligence (AI) training and inference, the increasing popularity of air travel from rising disposable incomes and shifting consumption preferences, and mobile data demand growth to name a few.
Many infrastructure assets have explicit links to inflation through regulation, concession agreements or contracts. Other assets without an explicit link often have the pricing power to deliver similar (or better) outcomes. This reflects their strong strategic position which limits competition.
We estimate that over 70% of the assets we invest in have the ability to pass inflation through to the end-customer.
Combining these volume and pricing drivers with essential service, hard-to-replicate business models means that this top-line growth typically translates to earnings, cashflow and ultimately dividend growth. Regulated utilities and selected toll road companies provide good examples of this dynamic, with visible and resilient earnings growth coupled with plans to increase dividends over time. For example, the UK regulated utility sector aims to grow dividends by inflation on a yearly basis. As such, dividends form an important part of the total return proposition for many companies in these sectors.
In aggregate, we anticipate GLI dividends will grow at an annualised rate of approximately 5% to 6%2 over the next two years.
Regulated UK water and sewage treatment companies have inflation-linked dividend policies
Source: First Sentier Investors
Increasing payout ratios
Directional improvements in corporate governance and an increased focus on shareholder value have supported an expansion of dividend payout ratios over time. Japanese and Chinese stock markets have been relatively recent adoptees of these practices. As a result, we have seen Japanese passenger railway operators (East Japan Railway’s dividend payout ratio from 30% in FY25 to 40% by FY28) and the largest listed Chinese tower company (from 72% in 2022 to 76% in 2024) grow their payout ratios in the past few years. Looking forward, we expect Japan Airport Terminal and perhaps Beijing Airport to improve their respective shareholder return policies.
As infrastructure sectors mature and transition from an inorganic growth phase to predominantly organic growth drivers, we see scope for companies to increase shareholder returns as they work to optimise their balance sheets. Developed market towers are a prime example of this, with European operators setting multi-year dividend growth targets of between 5% and 7% per annum. American Liquefied Natural Gas export terminal pioneer Cheniere Energy has committed to growing its dividend by 10% per annum until the end of the decade. Targeting a very modest 20% payout ratio, we believe this growth rate could be expanded as additional trains3 complete construction and start to generate cash flows.
Lastly, as airports complete large and lumpy expansion projects, they enter a free cash flow cycle and become increasingly prone to increasing dividends. For example, in March 2025, Zurich Airport expanded its payout ratio from 40% of net profit to 50% with a further 25% payout if leverage drops below certain thresholds. Looking ahead, as German airport operator Fraport nears completion of the new Terminal 3 at Frankfurt Airport, the company is considering resuming dividend payments in 2026.
Special dividends
While – by their very definition – not as enduring as normal dividends, special dividends have a role to play in the GLI capital return toolkit, enabling companies to generate shareholder returns without reducing liquidity in the way that share buybacks can. It was pleasing to see Mexican airport, ASUR, return value to shareholders by paying an extraordinary dividend in early 2025.
Sometimes associated with asset disposals, special dividends give management teams the flexibility to reduce excess capital without committing to unsustainable payouts over longer time frames. The recent sale of port assets by Mexican transport infrastructure operator PINFRA, and the anticipated merger of Chinese gas utility ENN Energy, if completed, should see significant special dividends being paid by both companies.
Buybacks are the cherry on top
We believe the headline dividend yield doesn’t adequately reflect, and in fact understates, the remuneration available to global listed infrastructure shareholders. Buybacks or share repurchases are the icing on the cake in the capital management toolkit of management teams looking to opportunistically or programmatically return capital to shareholders.
Frustratingly, they do not appear in the form of dividends (or income), which we appreciate are important for many investors. Buybacks typically boost earnings per share or cashflow per share which supports the total return. As fundamentals-focused, bottom-up investors, we are generally indifferent between return of capital via dividends or through buybacks: we love both! We think buybacks make sense when listed companies trade at a discount to intrinsic value or when there is a lack of compelling risk-adjusted capital investment opportunities.
Conceptually, non-utility infrastructure companies are well placed to return capital over time: large upfront capital investment into an asset that offers an essential service followed by a multi-year period of free cashflow harvesting. Within the GLI opportunity set, energy midstream, toll roads and towers provide particularly good examples of assets with low maintenance capex needs (and hence high free cash flow).
In line with this approach, US towers have established multi-billion-dollar buyback authorisations. SBA Communications and American Tower opportunistically repurchased shares in 2025, with a planned buyback from peer Crown Castle expected to follow. SBA has repurchased approximately 2.5% of Shares on Issue per annum over the past decade. Natural Gas Liquids infrastructure provider Targa Resources uses a combination of buybacks and dividends to form their shareholder remuneration.
Furthermore, in the most economically-sensitive sectors of GLI – freight railroads and waste management – buybacks form a large part of the return equation whilst offering flexibility to buffer against fluctuations in freight demand. While North American railroad dividend yields and payout ratios have been (relatively) low historically; share repurchases have regularly occurred over the past decade, typically representing between 3% and 5% of Shares on Issue per annum. Periods where this has not occurred have been after company-defining acquisitions such as the merger of Canadian Pacific and Kansas City Southern in 2023 and the recently-announced merger between Union Pacific and Norfolk Southern. With Union Pacific forecasting a resumption of buybacks in 2028, we eagerly anticipate this trend continuing.
Japanese gas utilities’ greater focus on capital efficiency and Return On Equity targets have seen the three largest listed stocks initiate or upsize buyback programs in the past two years. The size of the annual buybacks have been multiples of their dividend payments, which reinforces our belief that dividend yield is not the only metric by which shareholder returns should be measured.
Conclusion
Healthy shareholder income underpins the total return proposition of global listed infrastructure. With a dividend yield in the upper half of the historic 3%-4% range and growing owing to earnings growth, inflation linkage and improving capital efficiency, alongside potential share buybacks, we believe GLI’s income is well worth considering.
1 The proportion of a company’s earnings that is paid to shareholders as dividends
2 Simple average of GLI universe, 2026-27, Bloomberg
3 LNG trains are large-scale processing units that cool and condense natural gas into a liquid.
Global Listed Infrastructure
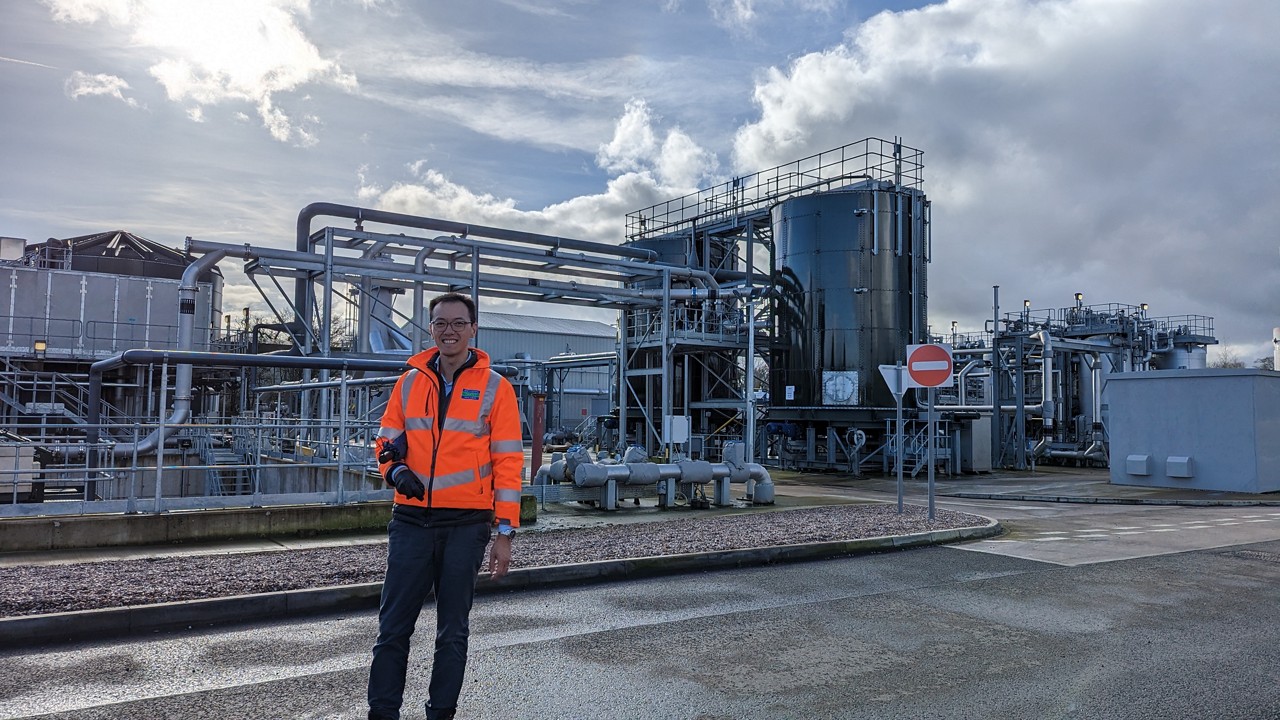
Infrastructure powers the world we live in – and when it comes to on-the-ground research, our team can be found on site
Investing in global listed infrastructure can offer inflation-protected income and steady capital growth from real assets delivering essential services. We search for best-in-class assets worldwide with high barriers to entry, structural growth and pricing power.
Read our latest insights
Important Information
This materialis for general information purposes only. It does not constitute investment or financial advice and does not take into account any specific investment objectives, financial situation or needs. This is not an offer to provide asset management services, is not a recommendation or an offer or solicitation to buy, hold or sell any security or to execute any agreement for portfolio management or investment advisory services and this material has not been prepared in connection with any such offer. Before making any investment decision you should conduct your own due diligence and consider your individual investment needs, objectives and financial situation and read the relevant offering documents for details including the risk factors disclosure.
Any person who acts upon, or changes their investment position in reliance on, the information contained in these materials does so entirely at their own risk.
We have taken reasonable care to ensure that this material is accurate, current, and complete and fit for its intended purpose and audience as at the date of publication. No assurance is given or liability accepted regarding the accuracy, validity or completeness of this material.
To the extent this material contains any expression of opinion or forward‑looking statements, such opinions and statements are based on assumptions, matters and sources believed to be true and reliable at the time of publication only. This material reflects the views of the individual writers only. Those views may change, may not prove to be valid and may not reflect the views of everyone at First Sentier Group.
Past performance is not indicative of future performance. All investment involves risks and the value of investments and the income from them may go down as well as up and you may not get back your original investment. Actual outcomes or results may differ materially from those discussed. Readers must not place undue reliance on forward‑looking statements as there is no certainty that conditions current at the time of publication will continue.
References to specific securities (if any) are included for the purpose of illustration only and should not be construed as a recommendation to buy or sell the same. Any securities referenced may or may not form part of the holdings of First Sentier Group portfolios at a certain point in time, and the holdings may change over time.
References to comparative benchmarks or indices (if any) are for illustrative and comparison purposes only, may not be available for direct investment, are unmanaged, assume reinvestment of income, and have limitations when used for comparison or other purposes because they may have volatility, credit, or other material characteristics (such as number and types of securities) that are different from the funds managed by First Sentier Group.
Selling restrictions
Not all First Sentier Group products are available in all jurisdictions.
This material is neither directed at nor intended to be accessed by persons resident in, or citizens of any country, or types or categories of individual where to allow such access would be unlawful or where it would require any registration, filing, application for any licence or approval or other steps to be taken by First Sentier Group in order to comply with local laws or regulatory requirements in such country.
This material is intended for ‘professional clients’ (as defined by the UK Financial Conduct Authority, or under MiFID II), ‘wholesale clients’ (as defined under the Corporations Act 2001 (Cth) or Financial Markets Conduct Act 2013 (New Zealand) and ‘professional’ and ‘institutional’ investors as may be defined in the jurisdiction in which the material is received, including Hong Kong, Singapore, Japan, and the United States, and should not be relied upon by or be passed to other persons.
The First Sentier Group funds referenced in these materials are not registered for sale in the United States and this document is not an offer for sale of funds to US persons (as such term is used in Regulation S promulgated under the 1933 Act). Fund-specific information has been provided to illustrate First Sentier Groups’ expertise in the strategy. Differences between fund-specific constraints or fees and those of a similarly managed mandate would affect performance results.
About First Sentier Group
References to ‘we’, ‘us’ or ‘our’ are references to First Sentier Group, a global asset management business which is ultimately owned by Mitsubishi UFJ Financial Group (MUFG). Certain of our investment teams operate under the trading names AlbaCore Capital Group, First Sentier Investors, FSSA Investment Managers, Stewart Investors and RQI Investors all of which are part of the First Sentier Group.
This material may not be copied or reproduced in whole or in part, and in any form or by any means circulated without the prior written consent of First Sentier Group.
We communicate and conduct business through different legal entities in different locations. This material is communicated in:
- Australia and New Zealand by First Sentier Investors (Australia) IM Ltd, authorised and regulated in Australia by the Australian Securities and Investments Commission (AFSL 289017; ABN 89 114 194311)
- European Economic Area by First Sentier Investors (Ireland) Limited, authorised and regulated in
- Ireland by the Central Bank of Ireland (CBI reg no. C182306; reg office 70 Sir John Rogerson’s Quay, Dublin 2, Ireland; reg company no. 629188)
- Hong Kong by First Sentier Investors (Hong Kong) Limited and has not been reviewed by the Securities & Futures Commission in Hong Kong. First Sentier Group, First Sentier Investors, FSSA Investment Managers, Stewart Investors, RQI Investors and Igneo Infrastructure Partners are the business names of First Sentier Investors (Hong Kong) Limited.
- Singapore by First Sentier Investors (Singapore) (reg company no. 196900420D) and this advertisement or material has not been reviewed by the Monetary Authority of Singapore. First Sentier Group (registration number 53507290B), First Sentier Investors (registration number 53236800B), FSSA Investment Managers (registration number 53314080C), Stewart Investors (registration number 53310114W), RQI Investors (registration number 53472532E) and Igneo Infrastructure Partners (registration number 53447928J) are the business names of First Sentier Investors (Singapore).
- United Kingdom by First Sentier Investors (UK) Funds Limited, authorised and regulated by the Financial Conduct Authority (reg. no. 2294743; reg office Finsbury Circus House, 15 Finsbury Circus, London EC2M 7EB)
- United States by First Sentier Investors (US) LLC, registered with the Securities Exchange Commission (SEC# 801‑93167).
- other jurisdictions, where this document may lawfully be issued, by First Sentier Investors International IM Limited, authorised and regulated in the UK by the Financial Conduct Authority (FCA ref no. 122512; Registered office: 23 St. Andrew Square, Edinburgh, EH2 1BB; Company no. SC079063)
To the extent permitted by law, MUFG and its subsidiaries are not liable for any loss or damage as a result of reliance on any statement or information contained in this document. Neither MUFG nor any of its subsidiaries guarantee the performance of any investment products referred to in this document or the repayment of capital. Any investments referred to are not deposits or other liabilities of MUFG or its subsidiaries, and are subject to investment risk, including loss of income and capital invested.
© First Sentier Group
