
At AlbaCore, we focus on the long-term. As one of Europe’s leading alternative credit specialists, we invest in private capital solutions, opportunistic and dislocated credit and structured products.
Discover moreInvestment strategies
Insights
Specialist in Asia Pacific, China, India and South East Asia and Global Emerging Market equities.
Discover moreOur philosophy is very simple. We are constantly searching for high quality businesses and when we acquire them, we will work relentlessly with them to create long-term sustainable value through innovation, ESG-led and proactive asset management.
Discover moreInvestment strategies
Insights
Leader in active quantitative equities across Australian equities, global equities, emerging markets and global small companies.
Backed by a unique blend of research, portfolio construction and risk management, focused on uncovering original insights and translating them into investment strategies that are active and systematic, aiming to generate alpha.
Discover moreInvestment strategies
Insights
Specialists in equity portfolios in Asia Pacific, emerging markets, global and sustainable investment strategies
Discover more
This document is a financial promotion for The First Sentier High Yield Fixed Income Strategy. This information is for professional clients only in the EEA and elsewhere where lawful. Investing involves certain risks including:
- The value of investments and any income from them may go down as well as up and are not guaranteed. Investors may get back significantly less than the original amount invested.
- Currency risk: the Fund invests in assets which are denominated in other currencies; changes in exchange rates will affect the value of the Fund and could create losses. Currency control decisions made by governments could affect the value of the Fund's investments and could cause the Fund to defer or suspend redemptions of its shares..
- Credit risk: the issuers of bonds or similar investments that the Fund buys may get into financial difficulty and may not pay income or repay capital to the Fund when due.
- Interest rate risk: bond prices have an inverse relationship with interest rates such that when interest rates rise, bonds may fall in value. Rising interest rates may cause the value of your investment to fall.
- Currency hedged share class risk: Hedging transactions are designed to reduce currency risk for investors. There is no guarantee that the hedging will be totally successful or that it can eliminate currency risk entirely.
- Derivative risk: derivatives are sensitive to changes in the value of the underlying asset(s) and/or the level of the rate(s) from which they derive their value. A small movement in the value of the assets or rates may result in gains or losses that are greater than the amount the Fund has invested in derivative transactions, which may have a significant impact on the value of the Fund.
- Below investment grade risk: below investment grade debt securities are speculative and involve a greater risk of default and price changes than investment grade debt securities. In periods of general economic difficulty, the market prices of these types of securities may decline significantly.
For details of the firms issuing this information and any funds referred to, please see Terms and Conditions and Important Information.
For a full description of the terms of investment and the risks please see the Prospectus and Key Investor Information Document for each Fund.
If you are in any doubt as to the suitability of our funds for your investment needs, please seek investment advice.
Thoughts on the Market
Following the economic and market malaise in February and March, high yield and risk assets generally experienced five straight months of strong performance, only to pull back in September. With a coordinated push from central banks in the form of zero rates and $3 trillion in QE the markets rebounded sharply from their lows in March with the equity markets, as measured by the S&P 500, posting a second quarter return of +20.54%, followed by a +8.93% return in the third quarter. The renewed confidence in the US economy because of Fed stimulus and general improved understanding and combating of COVID-19 helped to propel risk assets higher. In September that sentiment reversed course. Growing concerns surrounding a second COVID-19 wave in the US combined with the upcoming flu season, questions about when another US stimulus deal is approved, and the uncertainty around the US election outcome all added to uncertainty that weighed on the markets as the third quarter closed.
We continue to expect monetary support from the central banks and while we have stated before we are not fans of such massive stimulus programs, we believe renewed uncertainty in the markets will create attractive entry points to risk assets generally and specifically for high yield. As rates remain near zero on absolute terms and negative on real terms, traditional investment grade fixed income is experiencing somewhat of an existential crisis, while high yield has recently increased in size, after 6 years of modest decline. Given the maturation of the high yield market, and its proven long-term benefits, we expect the high yield market to continue the growth experienced in 2020 as the benefits of higher income and lower volatility come to bear. The excess in the credit market may this time come via the leveraged loans and private credit, or at least more heavily tilted in those areas relative to high yield. While there is the potential for credit loss in the public high yield market, the bottom-up perspective of our investment process navigates any market environment well. As well, our rigid margin-of-safety requirements never change, and our relative value methodology across the risk spectrum of credits and that fit our process naturally accounts for increased economic uncertainty.
The US High Yield market, as represented by the ICE BofAML US High Yield Constrained Index (HUC0) followed up the tumultuous first six months of the year with a solid third quarter, posting a +4.70% total return. This pushed the index total return for YTD’20 nearly positive with a return of -0.38%, practically wiping out the -13.13% return in the first quarter. As of quarter end, the spread and yield of the US High Yield Market was +547 bps, and 5.78%, which represent moves tighter/lower of 102 bps, and 1.11%, during the period. The Leveraged Loan market also exhibited another solid quarter in Q320 with a total return of +4.11%, pushing the YTD’20 total return to -0.57%.
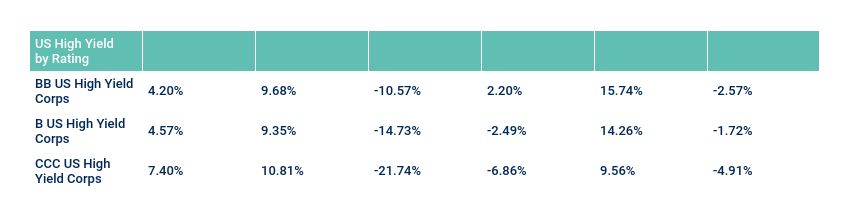
From a credit quality perspective, similar to Q220, CCCs led the way higher, up +7.40% relative to single Bs and BBs at +4.57% and +4.20%, respectively. However, the significant underperformance of CCCs in Q120 left their YTD’20 total return lagging at -6.86%, compared to single Bs and BBs at -2.49% and +2.20%, respectively.
Investment Grade Credit posted solid returns during the quarter and YTD’20, returning +1.69% and +6.62%, respectively. The YTD’20 return advantage relative to high yield was due to the very strong Q120 return, driven by the collapse of the 5-year UST rate from 1.69%, to 0.38%. The ICE BofA US (IG) Corporate Index (C0A0) ended Q320 with a spread duration of 7.4 years, compared to just 3.8 years for high yield. Big picture, we continue to see IG issuers susceptible to downgrades throughout the year. As well, investment grade corporate new issuance has already surpassed last year’s total and is just 7% below the prior annual record of $1.25T in 2017. Barring negative UST rates, IG corporate returns seem challenged at an index spread and yield of +155 bps and 2.22%. On the other hand, we look forward to potential relative value opportunities among fallen angels.
Exhibit 1: Returns of Various Assets
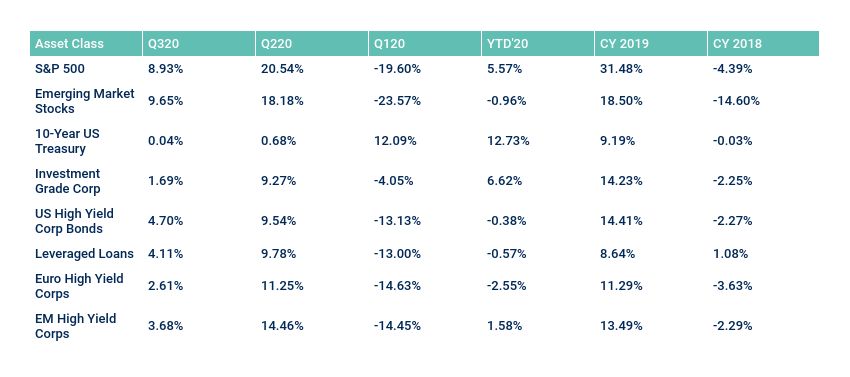
Source: JP Morgan, ICE BAML
High Yield Market Commentary
During 3Q’20, the ICE BofA US High Yield Constrained Index (HUC0) total return was +4.70%, while the S&P 500 Index returned +8.93%, and 10-Year US Treasuries returned +0.04%. Total returns for YTD’20 were -0.38% for the HUC0 HY Index, +5.57% for the S&P 500, and +12.73% for 10-Year US Treasuries as central bank policy remains steadfast.
At quarter end, the high yield market, as represented by the ICE BofA US High Yield Constrained Index (HUC0), spread-to-worst (STW) and yield-to-worst (YTW) were +547 bps and 5.78%, and 102 bps and 1.11% tighter/lower during the quarter. Retail High Yield Fund flows, while overall a tailwind, provided a similar pattern as returns, i.e., following the exodus from HY funds in March (-$11.7 billion) high yield funds posted five straight positive flows only to see that reversed in September with a -$4.3 billion outflow. While negative for September, 3Q’20 posted a net inflow of +$10.7 billion. New issuance continued the record setting pace set by 2Q’20 to produce the second largest quarter on record at $132 billion.
Returns for the First Sentier Investors’ High Yield strategy remained solid during 3Q’20. The Broad High Yield strategy returned +5.35%, outperforming its benchmark index by 65 bps. The Quality and Select strategies returned +5.00% and +5.91%, outperforming their benchmark indices by 67 and 121 bps for the quarter, respectively. The Short Duration strategy returned +3.54%, underperforming by 3 bps.
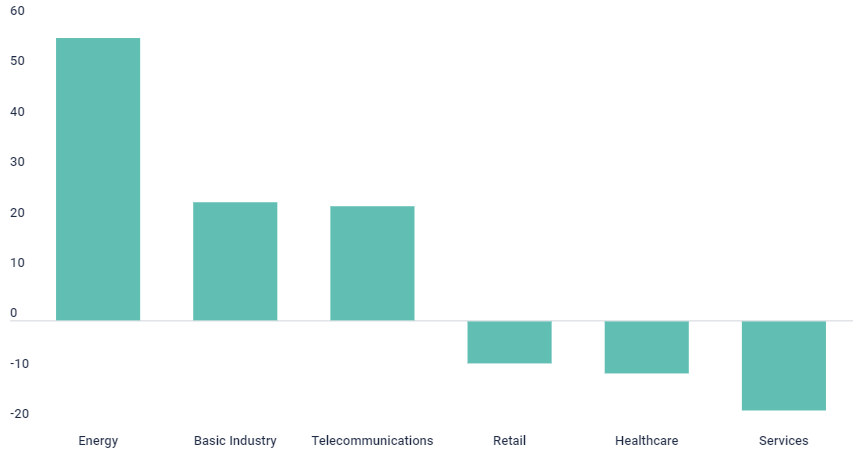
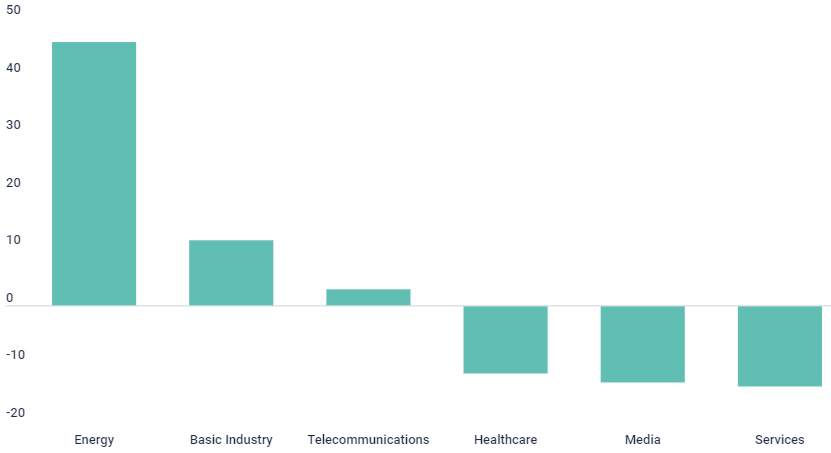
Top performers included Energy, Basic Industry, and Telecom. Across all three industries performance has been driven by bottom-up security selection, as we continue to be able to find good investment ideas that have positive catalysts driving total return. Bottom performers include Services, Healthcare, and Retail. In Services, we had a security underperform the rally this quarter, but still have conviction in the name, and in Healthcare and Retail, we didn’t see much value in a lot of the names across these industries, and missed some of the general tightening that occurred in both.
ICE BofA US High Yield Constrained Index (HUC0) Index Characteristics
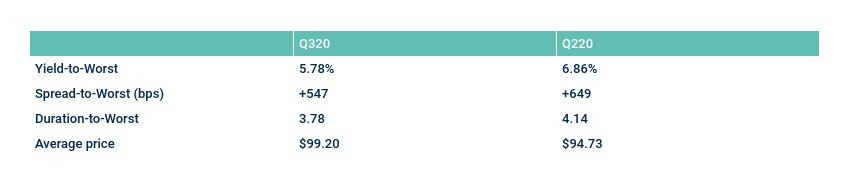
Source: ICE BAML
High Yield Composite Gross Performance - Annualised
As of 30 September 2020 Inception 30 April, 2017
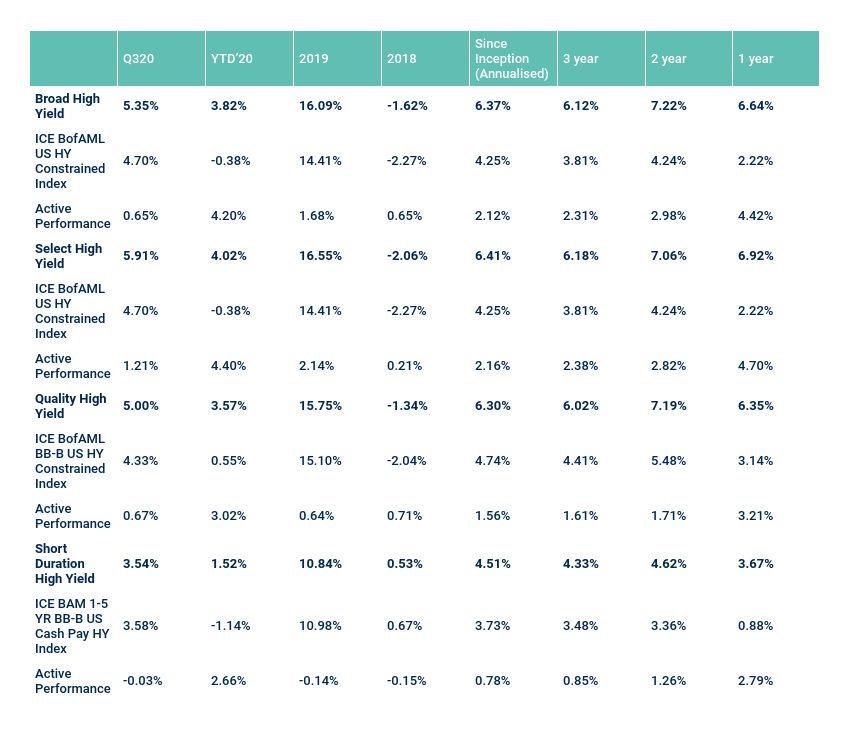
First Sentier Investors as at 30 September 2020. Composite inception date is 1 May 2017. Shown as gross of fees in USD, deducting institutional share class fees (AMC: 0.40%). The assets within the FSI Select High Yield Composite and the FSI Quality High Yield Composite have been combined to create the FSI Broad High Yield Composite. These figures refer to the past. Past performance is not a reliable indicator of future results.
High Yield Composite Net Performance - Annualised
As of 30 September 2020 Inception 30 April, 2017
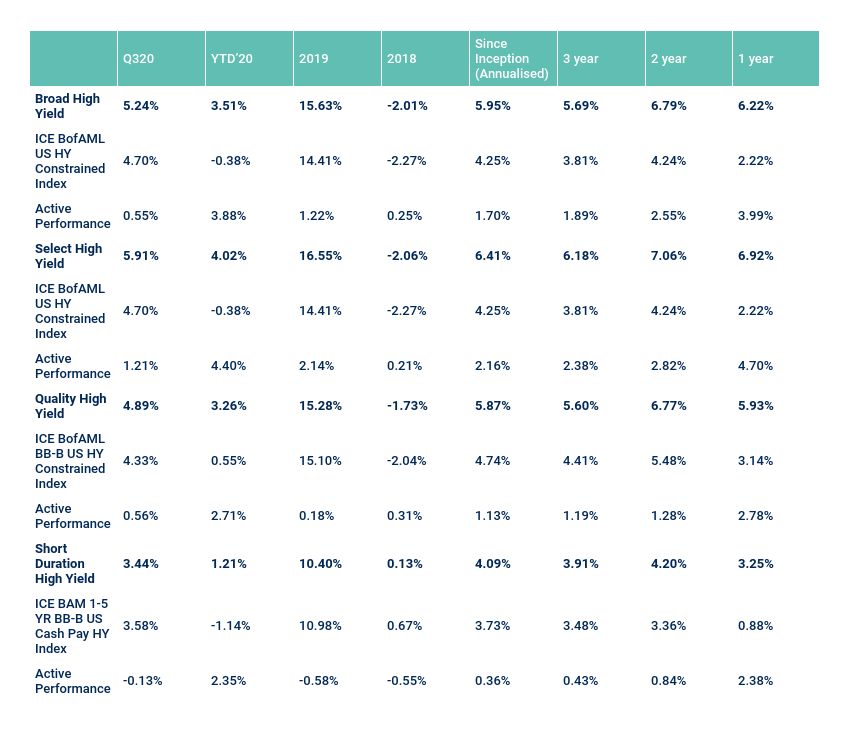
First Sentier Investors as at 30 September 2020. Composite inception date is 1 May 2017. Shown as net of fees in USD, deducting institutional share class fees (AMC: 0.40%). The assets within the FSI Select High Yield Composite and the FSI Quality High Yield Composite have been combined to create the FSI Broad High Yield Composite. These figures refer to the past. Past performance is not a reliable indicator of future results.
High Yield Composite Net Performance - Discrete
As of 30 September 2020 Inception 30 April, 2017
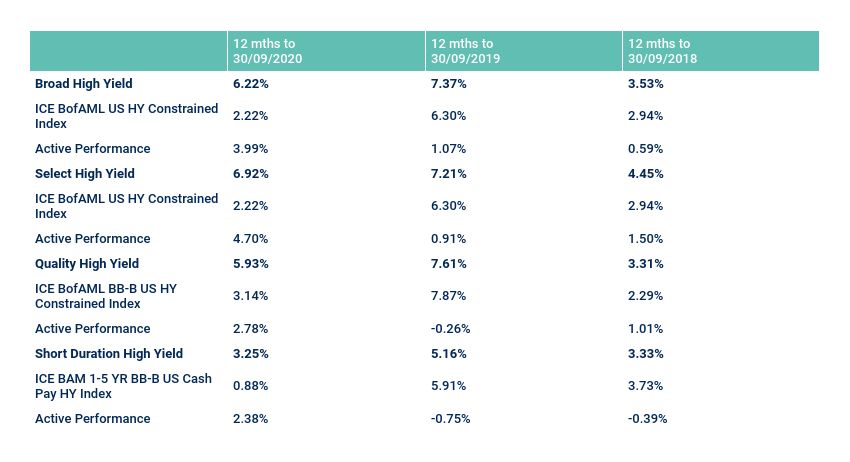
First Sentier Investors as at 30 September 2020. Composite inception date is 1 May 2017. Shown as net of fees in USD, deducting institutional share class fees (AMC: 0.40%). The assets within the FSI Select High Yield Composite and the FSI Quality High Yield Composite have been combined to create the FSI Broad High Yield Composite. These figures refer to the past. Past performance is not a reliable indicator of future results.
Strategy review
We are the beneficiaries of an investment process that is contrarian by design. While many of our competitors may be stretching for yield at the expense of uncompensated default risk, we expect our investment process to result in an underweight in relative credit risk. Over the life of our investment process, we’ve never experienced a meaningful high yield market correction that wasn’t a net opportunity to increase yields and total return over the longer term, net of any default experience. Therefore, rather than fear market corrections, we view them as net opportunities to set up our portfolios for their strongest, absolute total return. As you can see from our performance in the first quarter, second quarter and YTD for 2020, our investment process has guided us to strong outperformance in the current volatile markets.
With our disciplined process as our foundation, we expect market dynamics will continue to present both opportunities and challenges for investors. As the overall landscape changes for fixed income investors (e.g., negative yields, increased use of derivatives), we continue to remain confident in both our process and our team’s relentless commitment to execution in all markets. We believe that the High Yield market is among the most attractive markets in fixed income, and we remain able to construct a diversified portfolio that overcompensates us for the risk that we are taking. Finally, we believe First Sentier Investors is well-positioned in this market to produce dependable outperformance versus both peers and the benchmark.
FSI High Yield eVestment Performance and Risk Metrics
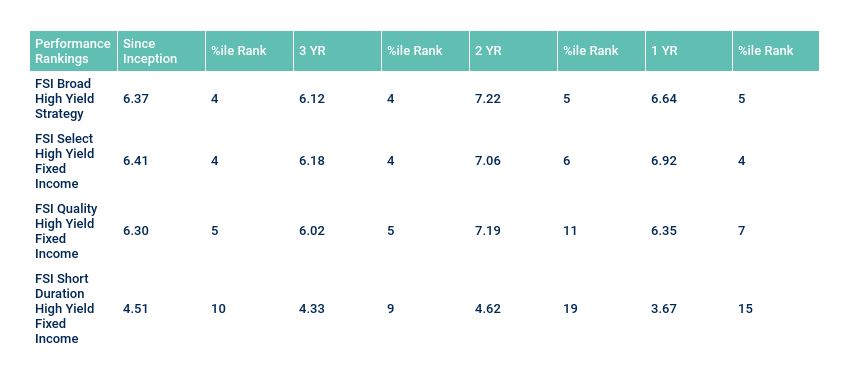
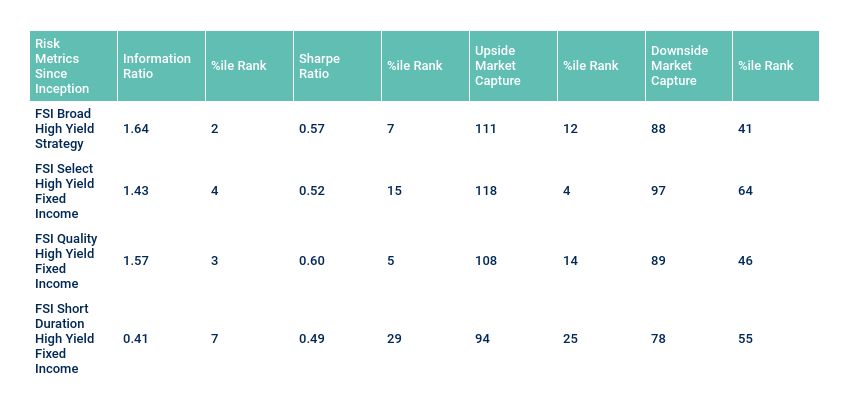
Peer group percentile rankings are versus eVestment’s US High Yield Fixed Income (for Broad & Select High Yield), Quality High Yield Fixed Income (for Quality High Yield) & Short Duration High Yield FI (for Short Duration High Yield) universes. Data shown includes all results reported in eVestment as of October 16, 2020 and does not reflect any selection by FSI.
Past performance is not indicative of future performance.
Positioning
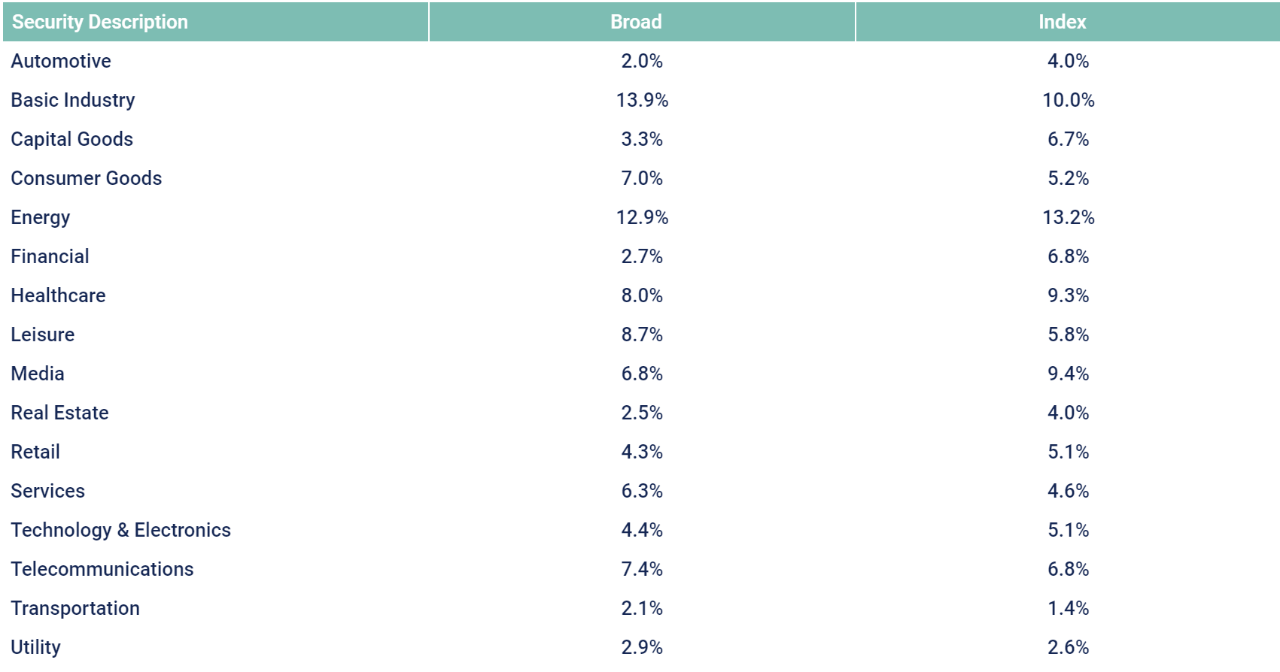
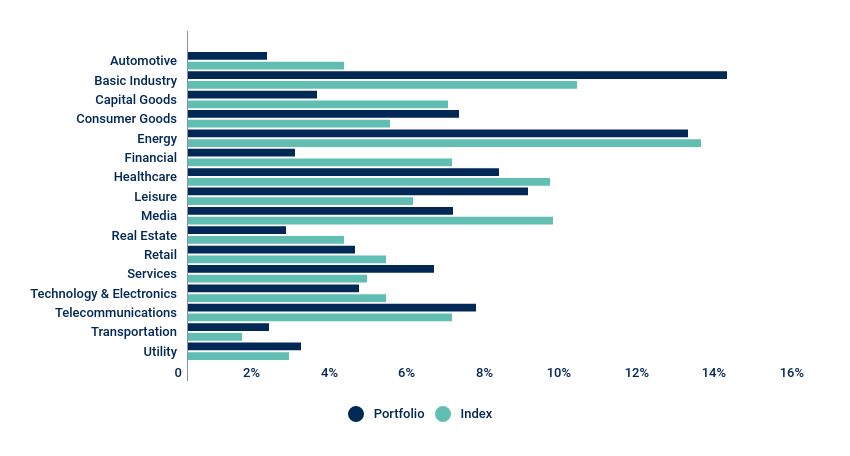
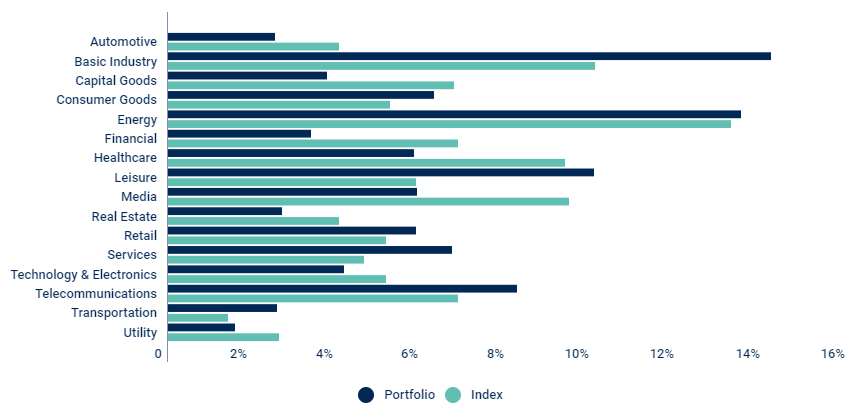
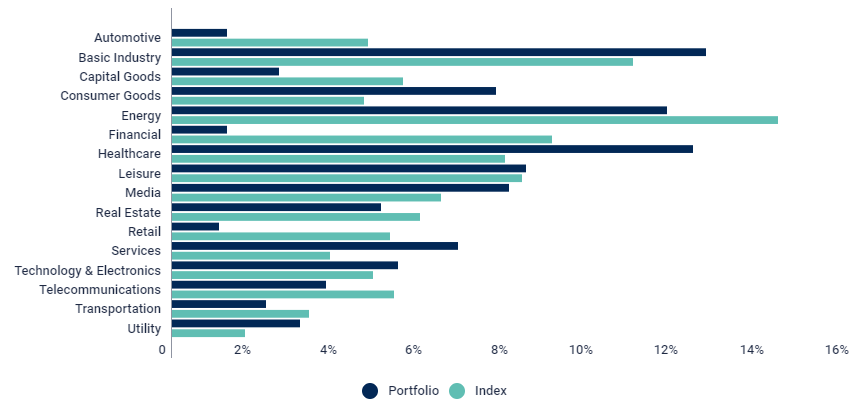
During the quarter, from a sector standpoint, led by our bottom-up relative value analysis, the Broad strategy* increased its exposure to Technology, Transportation and Utilities and took reduced exposure to Healthcare, Basic Industry and Services.
At quarter end, the Broad strategy is overweight in Basic Industry and Leisure. We continue to find good opportunities to deploy capital that meet our investment process in these sectors. We are underweight in Media and Healthcare as both of these sectors have tightened materially and we are not seeing as many attractive opportunities. Lastly we are approximately market weight in Energy and Retail, where the focus is on higher quality.
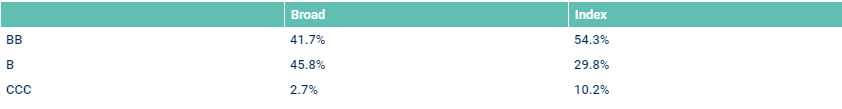
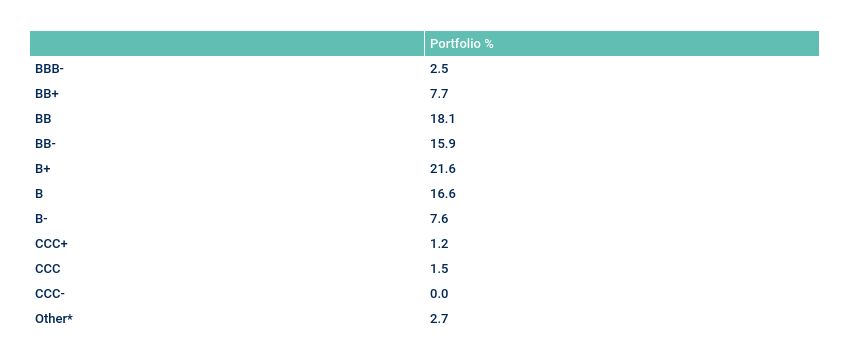
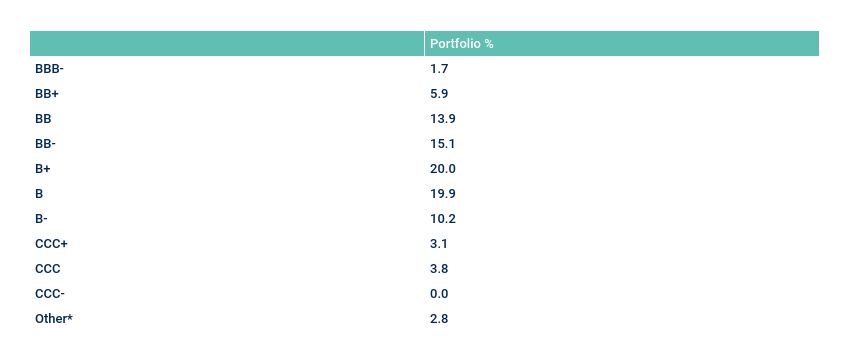
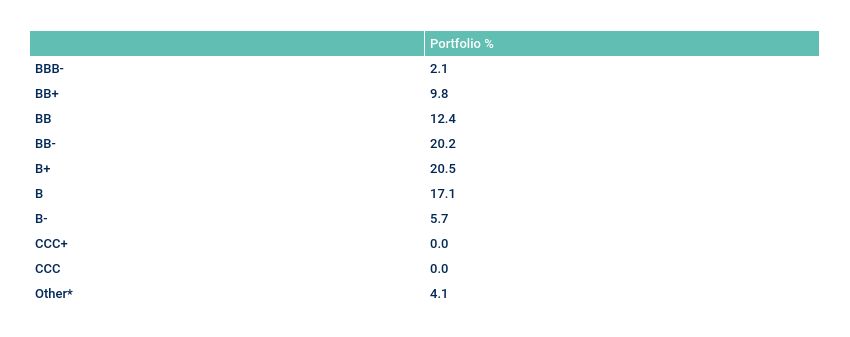
While our default-adjusted, relative value methodology is indifferent to rating agency metrics, we still track our composite exposures. Underweight exposures to CCCs and BBs were maintained, with a corresponding overweight to Bs. During the third quarter we maintained our exposure to Bs with a slight increase in cash to 4.5% as we look at relative value heading into October/November.
At quarter end, the Broad high yield strategy had a modest, single-digit % allocation to bank loans, and we’ve found select loans that fit our investment process and offer attractive relative value.
Breakdown by Rating
As of September 30, 2020
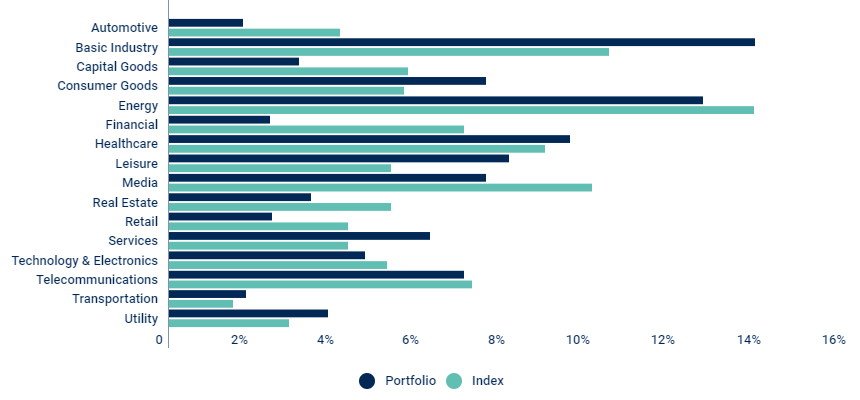
Sector Weightings
Outlook
The US election season is shaping up to be particularly interesting given the uncertainty of both the results and the timing of such results, and higher volatility than normal seems to be priced into current market conditions. The increasingly uncertain elements around the impact of a spike in COVID-19 cases and the uncertain timing of a new stimulus package, among other risks, highlight our conviction that effective investing in the High Yield market is first and foremost about risk control. Our investment process requires strict, absolute minimum margins-of-safety, based on real-world asset coverage and free cash flow generation.
We think current spreads are supportive of attractive relative value in high yield, with a focus on being in the “right” credits. Spreads have retraced ~80% of their COVID-related widening, but there still remain plenty of opportunities among sectors hit harder by COVID-related slowdowns in business fundamentals. As well, our portfolios have slowly repositioned to being underweight risk once again as our process naturally rotated our portfolios into a market neutral risk position after spending much of the first half of 2020 underweight risk. We expect active management to outperform over the foreseeable future as getting credit right remains paramount, and as always, we believe high yield investing is often as much about what you don’t own as what you do.
* The Broad High Yield strategy is a hypothetical portfolio, as the assets of the Select High Yield strategy and Quality High Yield strategy have been combined to create the characteristics of the Broad High Yield strategy.
Broad High Yield
Characteristics
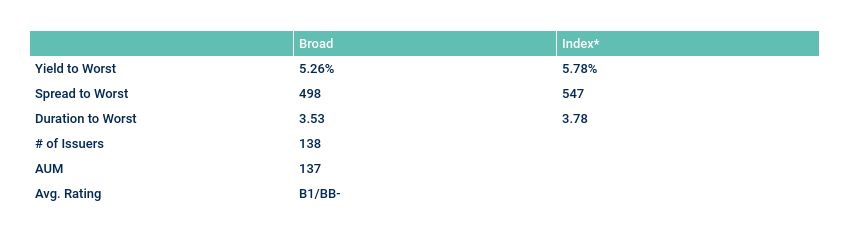
* Index as of quarter end rebalance
Sector weightings: Portfolio, Benchmark
Breakdown by Rating
* CC, C, D & NR
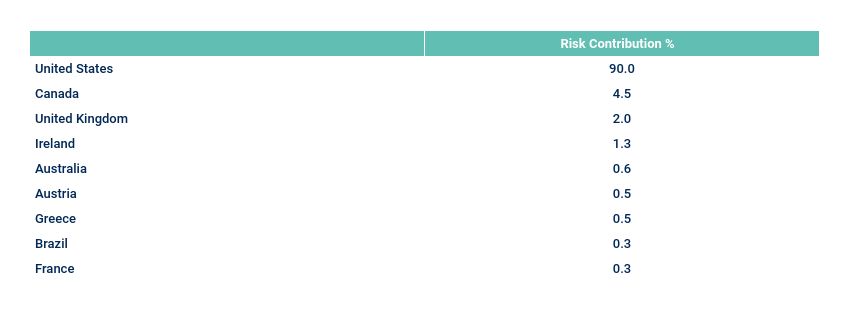
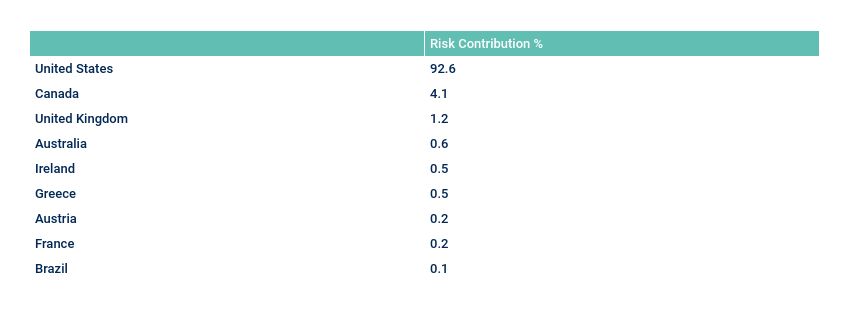
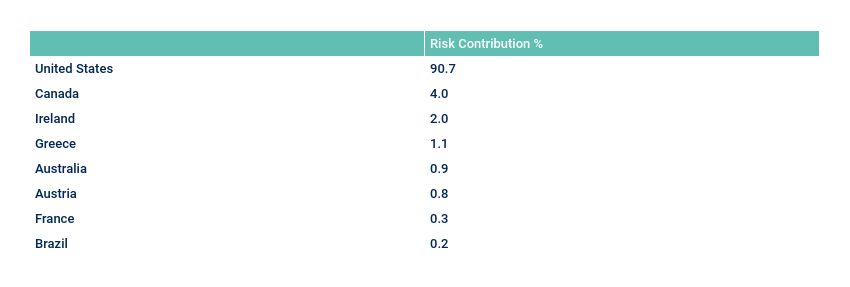
Breakdown by Country

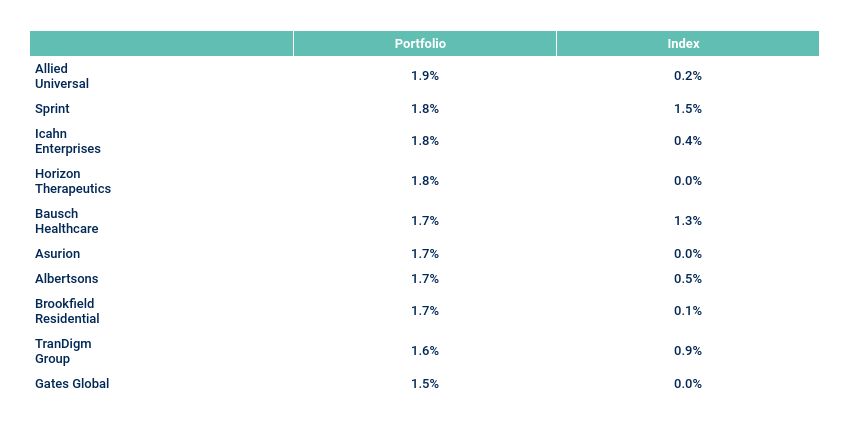
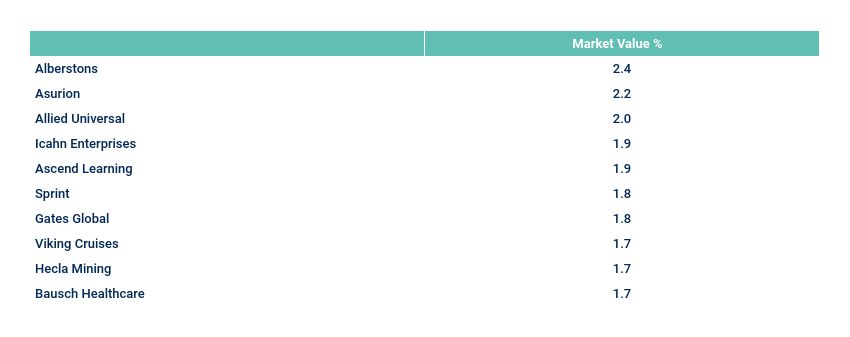
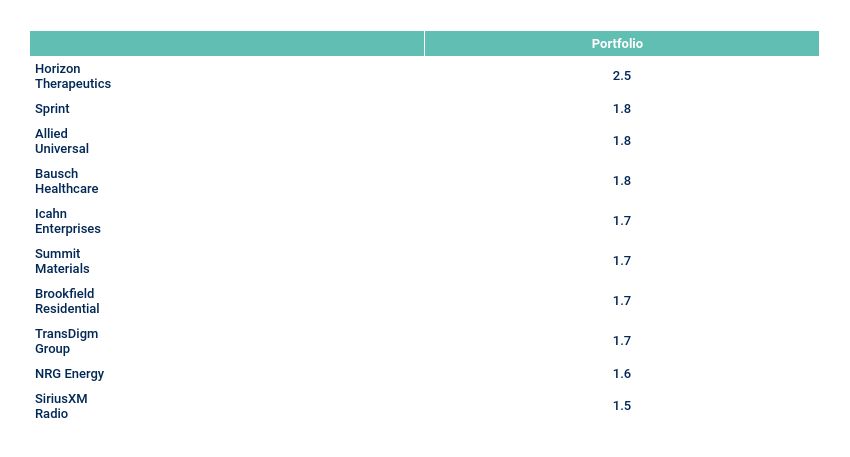
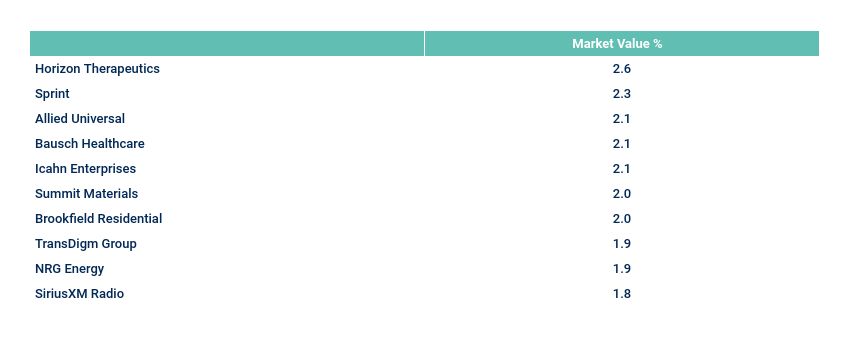
Top 10 Issuers
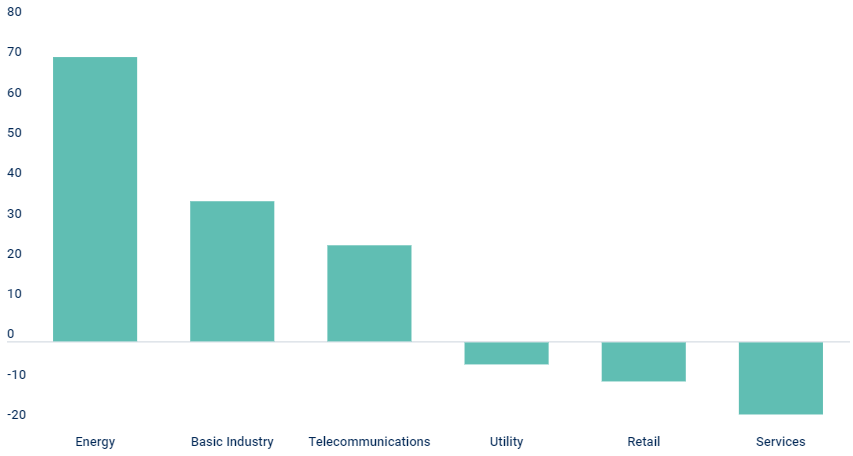
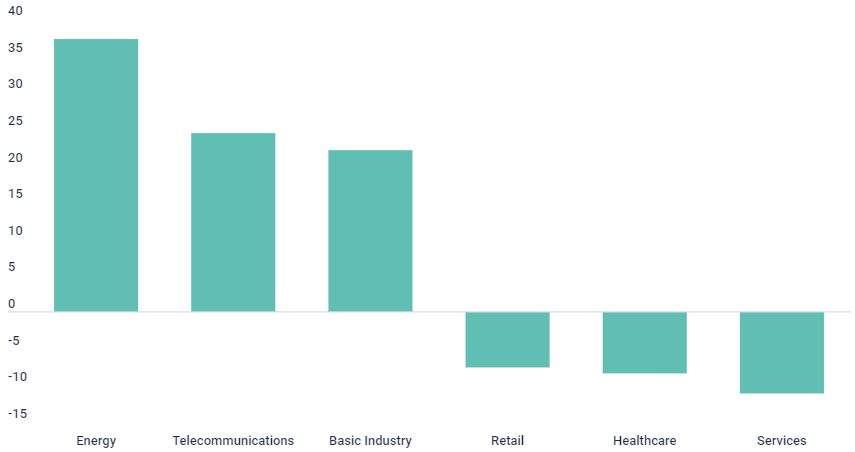
Top 3/Bottom 3 Contribution to Excess Return
* The Broad High Yield Composite is hypothetical, as the assets of the Select High Yield strategy and the Quality High Yield strategy have been combined to create the characteristics of the Broad High Yield strategy. Source: First Sentier Investors. Data as of September 30, 2020
Select High Yield
Characteristics
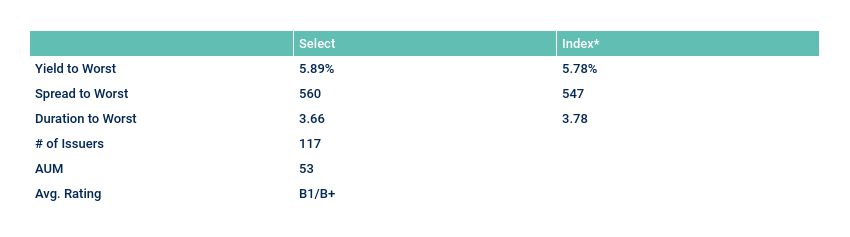
* Index as of quarter end rebalance
Sector weightings: Portfolio, Benchmark
Breakdown by Rating
* CC, C, D & NR
Breakdown by Country
Top 10 Issuers
Source: First Sentier investors. Data as of September 30, 2020
Top 3/Bottom 3 Contribution to Excess Return
Quality High Yield
Characteristics
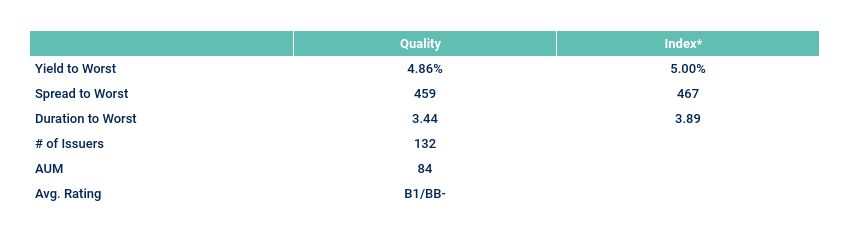
* Index as of quarter end rebalance
Sector weightings: Portfolio, Benchmark
Breakdown by Rating

* CC, C, D & NR
Breakdown by Country
Top 10 Issuers
Top 3/Bottom 3 Contribution to Excess Return
Source: First Sentier Investors. Data as of September 30, 2020
Short Duration High Yield
Characteristics
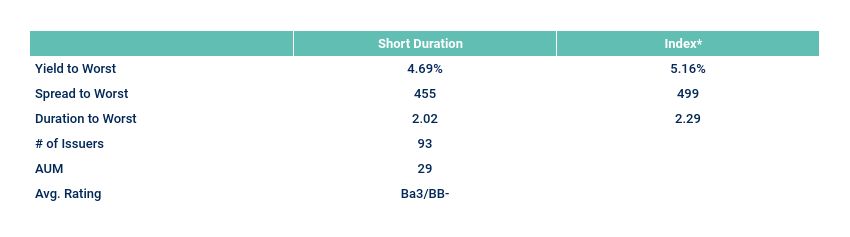
* Index as of quarter end rebalance
Sector weightings: Portfolio, Benchmark
Breakdown by Rating
* CC, C, D & NR
Breakdown by Country
Top 10 Issuers
Source: First Sentier Investors. Data as of September 30, 2020
Top 3/Bottom 3 Contribution to Excess Return
Source: First Sentier Investors. Data as of 30 September 2020
Important Information
This document has been prepared for informational purposes only, for Professional Clients, and is only intended to provide a summary of the subject matter covered. It does not purport to be comprehensive or to give advice. The views expressed are the views of the writer at the time of issue and may change over time. This is not an offer document and does not constitute an offer, invitation or investment recommendation to distribute or purchase securities, shares, units or other interests or to enter into an investment agreement. No person should rely on the content and/or act on the basis of any material contained in this document.
This document is confidential and must not be copied, reproduced, circulated or transmitted, in whole or in part, and in any form or by any means without our prior written consent. The information contained within this document has been obtained from sources that we believe to be reliable and accurate at the time of issue but no representation or warranty, express or implied, is made as to the fairness, accuracy, or completeness of the information. We do not accept any liability whatsoever for any loss arising directly or indirectly from any use of this document.
References to “we” or “us” are references to First Sentier Investors a member of MUFG, a global financial group. First Sentier Investors includes a number of entities in different jurisdictions.
Issued by First Sentier Investors International IM Limited which is authorised and regulated in the UK by the Financial Conduct Authority (registered number 122512). Registered office: 23 St. Andrew Square, Edinburgh, Midlothian, EH2 1BB number SCO79063.
First Sentier Investors entities referred to in this document are part of First Sentier Investors a member of MUFG, a global financial group. First Sentier Investors includes a number of entities in different jurisdictions. MUFG and its subsidiaries do not guarantee the performance of any investment or entity referred to in this document or the repayment of capital. Any investments referred to are not deposits or other liabilities of MUFG or its subsidiaries, and are subject to investment risk including loss of income and capital invested.
Copyright © (2020) First Sentier Investors
All rights reserved.
 |  |
|---|