This is a financial promotion for The First Sentier Global Listed Infrastructure Fund. This information is for professional clients only in the EEA and elsewhere where lawful. Investing involves certain risks including:
- The value of investments and any income from them may go down as well as up and are not guaranteed. Investors may get back significantly less than the original amount invested.
- Currency risk: the Fund invests in assets which are denominated in other currencies; changes in exchange rates will affect the value of the Fund and could create losses. Currency control decisions made by governments could affect the value of the Fund's investments and could cause the Fund to defer or suspend redemptions of its shares.
- Single sector risk: investing in a single economic sector may be riskier than investing in a number of different sectors. Investing in a larger number of sectors helps to spread risk.
- Listed infrastructure risk: the infrastructure sector and the value of the Fund is particularly affected by factors such as natural disasters, operational disruption and national and local environmental laws.
- Concentration risk: the Fund invests in a relatively small number of companies which may be riskier than a fund that invests in a large number of companies.
- Emerging market risk: Emerging markets tend to be more sensitive to economic and political conditions than developed markets. Other factors include greater liquidity risk, restrictions on investment or transfer of assets, failed/delayed settlement and difficulties valuing securities.
For details of the firms issuing this information and any funds referred to, please see Terms and Conditions and Important Information.
For a full description of the terms of investment and the risks please see the Prospectus and Key Investor Information Document for each Fund.
If you are in any doubt as to the suitability of our funds for your investment needs, please seek investment advice.
As we return to the skies for that first face-to-face meeting, reuniting with family or taking that well-deserved holiday, the airports we pass through will be markedly different to what we knew before. These changes might not be immediately obvious as you pass through security, browse duty-free or board your plane; but the implications are significant for investors.
Will I ever see your face again?
Much has been made of the transformational impacts that the pandemic has had on the way we work and communicate. With an endless number of studies and surveys pointing to varying levels of structural declines in business traffic as a result of the rapid shift towards virtual communication.
Anecdotally we can look towards Mexico for an indication of how things might progress, with Mexican air travel now returning to pre-pandemic levels we have seen some divergence in the recovery based on the passenger mix of an airport.
As demonstrated below leisure exposed airports (such as ASUR’s Cancun Airport) have seen a very strong recovery in traffic as vaccination rates have increased, whilst more business exposed airports have lagged in their recovery (such as OMA’s Monterrey Airport).
Figure 1. Business vs leisure recovery in Mexico
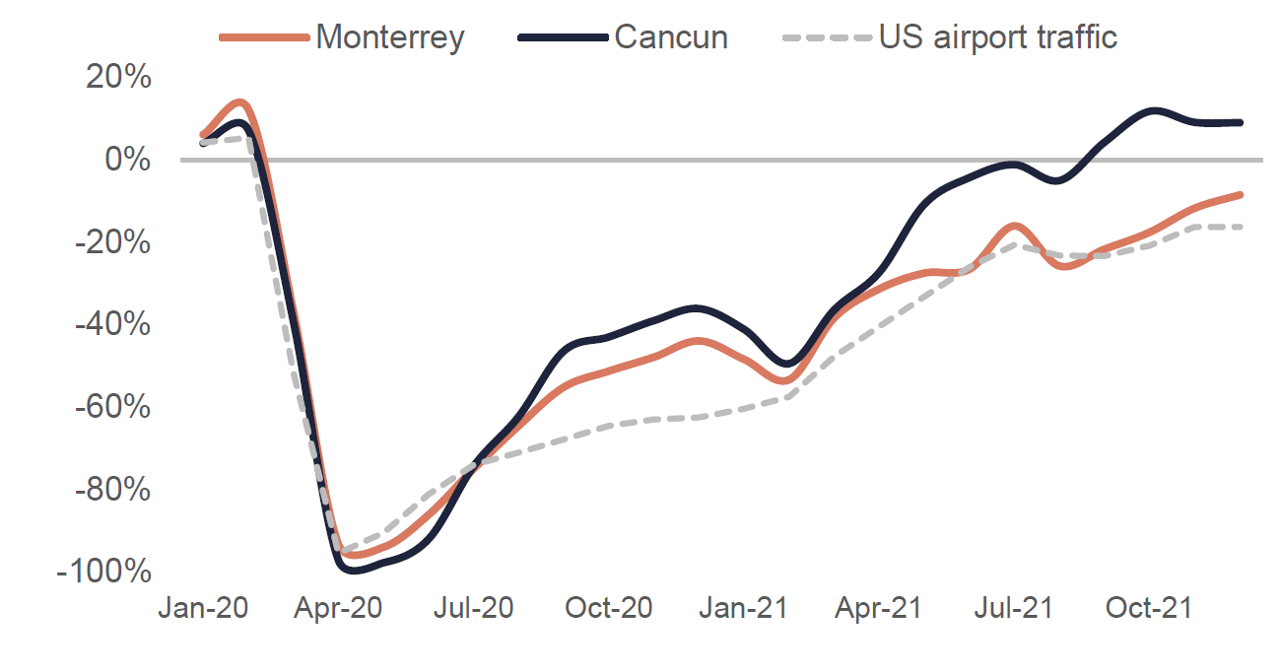
vs 2019
Source: company data, First Sentier Investors.
As at 31 December 2021.
Whilst the magnitude of the difference in Mexico is not necessarily directly translatable to other parts of the world, with differences in the purpose and distance of business travel being large factors in a decision to travel, we believe the principle will broadly hold across regions. This view is supported by a recent Bloomberg survey of large US corporates that found 84% expect to spend less on travel post-pandemic1. A change which can largely be attributed to the shift to virtual meetings, with Morgan Stanley finding that corporates expect this to take 29% of volumes in 2022 and 19% in 20232.
We forecast a 20% structural loss in long-haul passenger travel as a result of multiple headwinds, the largest of which is lower demand for corporate travel3. As a result, we favour more short‑haul, leisure exposed airports. Particularly European airports with large intra-Europe exposure, where the rigors of border restrictions are likely to be less cumbersome. We expect to see a strong rebound in traffic as travellers look to catch-up with friends & family and take a holiday, an investment thesis we have seen successfully play out in Mexico.
Figure 2: Airports passenger exposure
Purpose of travel
Source: company reports 2019, First Sentier Investors.
For the year ended 31 December 2019.
Goodbye to the big jet plane
The pandemic has seen hundreds of planes laying idle on airport tarmacs and deserts throughout the world, waiting to return to the skies. For some superjumbos that previously dominated the skies like the Airbus A380, this day may never come. The impacts of the pandemic and the changing economics of flying have led many of the world’s airlines such as Air France, Lufthansa, Qantas, Qatar and Singapore Airlines to significantly reduce or in some cases even fully retire their A380 fleets4.
Figure 3: Grounded aircraft during the Covid-19 pandemic
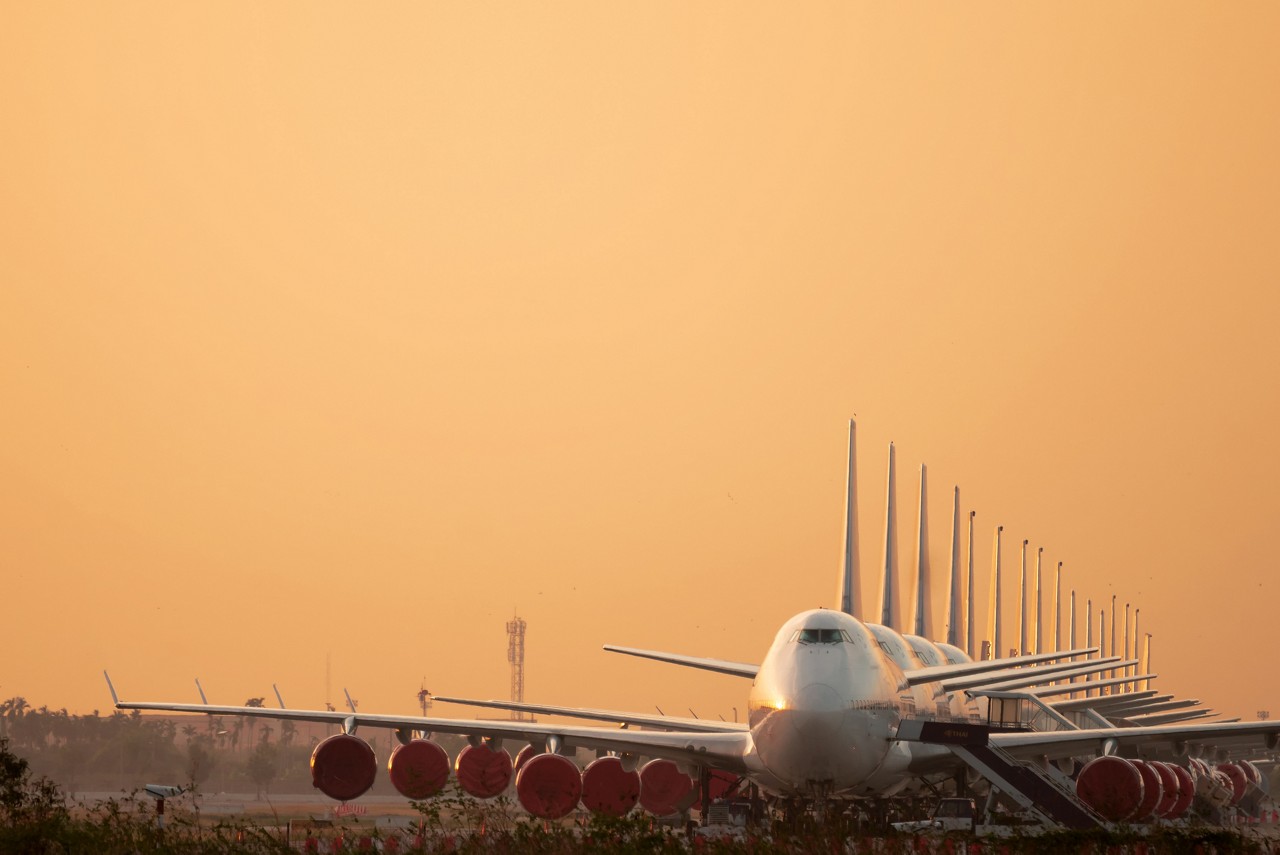
Source: Getty Images.
Airlines are increasingly shifting their fleets towards smaller, more fuel efficient and more flexible aircraft for long-haul operations. The clearest example of this is the shift from the ~550-seat Airbus A380 aircraft to the ~300-seat Boeing B787 Dreamliner. The implications of this shift for airports are two-fold; the first consequence is that more planes need to land and take-off to cater to the same number of passengers as they did in 2019. This posing a potential problem for airports that suffer from runway capacity constraints and had benefitted from the scale of the A380 as a result.
Figure 4: A380 vs 787 deliveries
Cumulative aircraft deliveries
Source: Airbus & Boeing company data, UBS.
As at 31 December 2021.
The second impact, which has more long-term and significant consequences, is the shift that is slowly occurring in airline route planning. With early signs of a transition in the global aviation structure from the hub-and-spoke model favoured by most long-haul airlines today to an increasingly point-to-point model. In the hub-and-spoke model, airlines serve passengers by filtering them to ‘hub’ airports and then connecting passengers on to their final destination via large aircraft to create economies of scale. Whilst under the point-to-point model the airline instead creates more direct routes serviced by smaller planes to take the passenger direct from point-A to point-B.
Figure 5: Hub-and-spoke vs point-to-point
Hub-and-spoke
8 destinations connected by
8 routes via hub
Point-to-point
8 destinations connected by
28 routes directly

Source: First Sentier Investors.
The implications of this are that airports which previously served as these ‘hubs’ face the risk of large structural declines in this portion of traffic which previously transited through their airport. These passengers are referred to as ‘transfer’ passengers; meaning that the airport is not their city of departure nor final destination but rather where they connect on to an onward flight at the airport.
Figure 6: Transfer vs local (destination) passengers
Transfer vs local
Source: company reports 2019, First Sentier Investors.
For the year ended 31 December 2019.
As a result of these risks we favour those airports with more limited exposure to transfer passengers. Preferring ‘destination’ airports whose traffic is driven by economic or tourism factors that necessitate travel to that specific airport. An example of this is Aena, the owner and operator of 46 airports and two heliports throughout Spain. This includes airports in destinations such as Barcelona, Madrid, Mallorca and Ibiza. As a result, Aena’s airports are the initial departure point or final destination for 93% of their passengers5.
Figure 7: Aena’s Adolfo Suárez Madrid-Barajas Airport
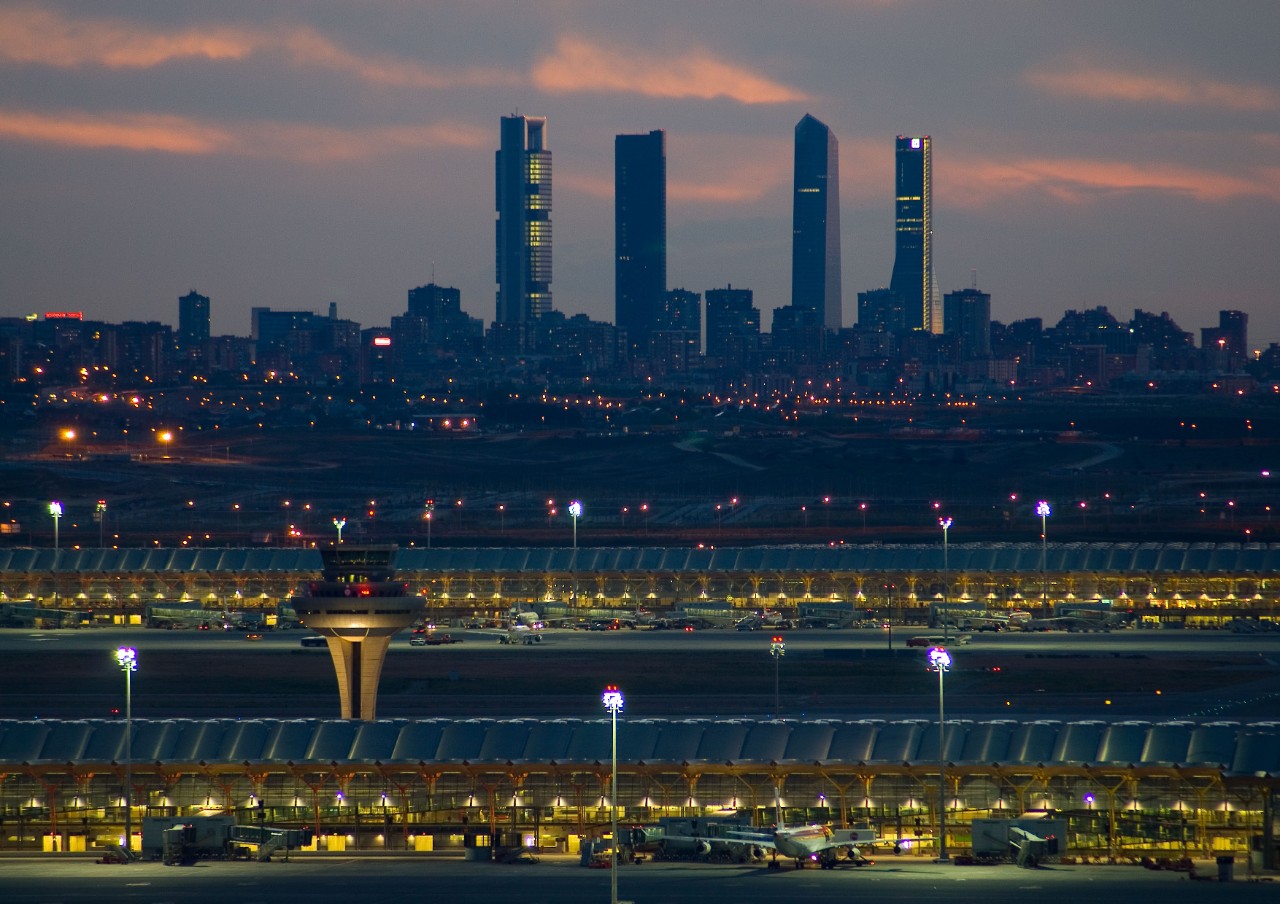
Source: Aena.
Share in the pain, share in the gain
When current duty free contracts were agreed between duty free retailers and airport operators prior to the pandemic, little consideration was given to uncontrollable events that could lead to prolonged loss of air traffic at airports. Whilst these events have occurred to varying extents before, such as September-11, the 2003 SARs and the Global Financial Crisis, duty free retailers had been prepared to take on this risk when bidding for airport retail concessions. This now looks set to change.
Figure 8: Duty free at Charles de Gaulle Airport, Paris
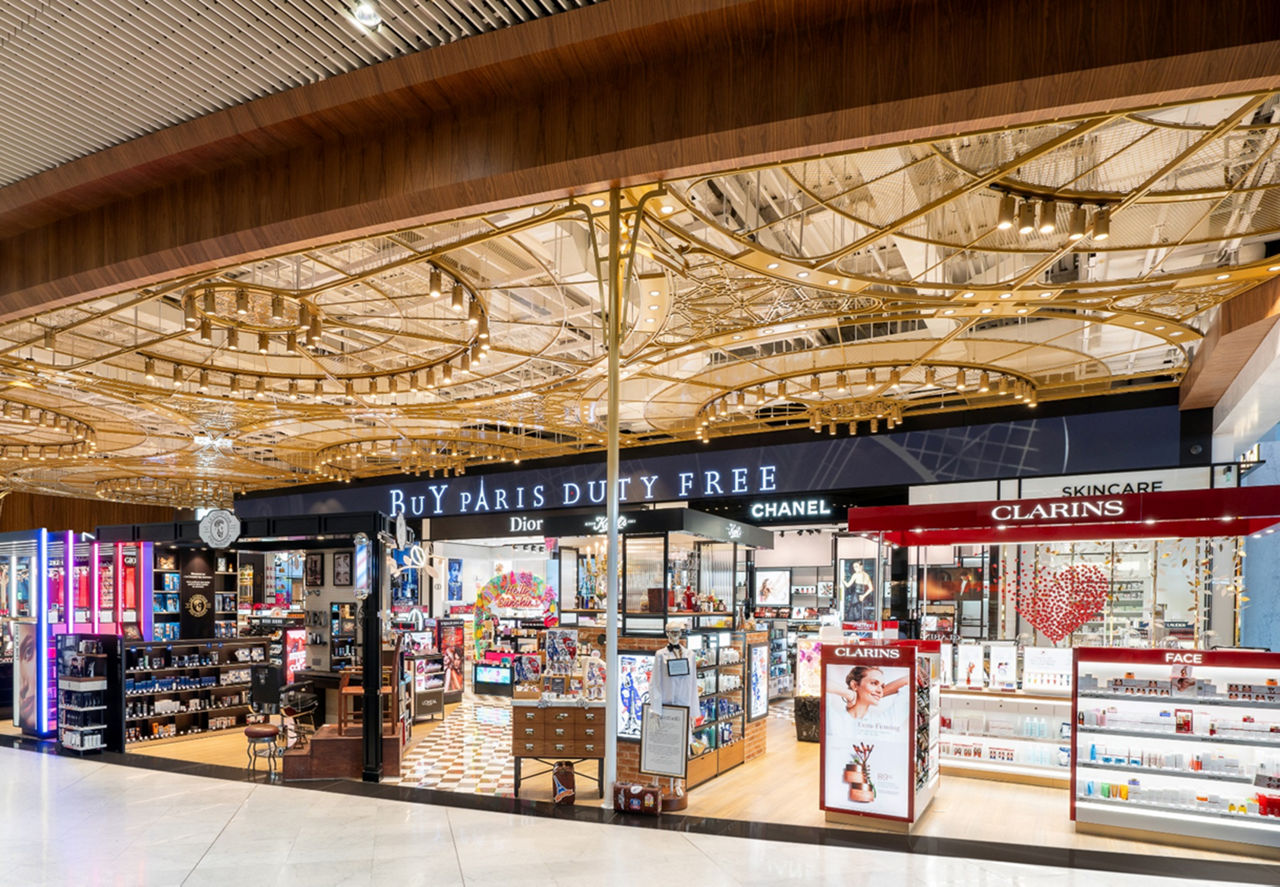
Source: Seignette Lafontan – ADP (ADP-P-2018-34278-BR).
Duty free concessions are typically structured around two payments, a fixed and a variable payment. The fixed payment is a minimum annual guaranteed (MAG) rent, an absolute amount which the retailers must pay to the airport operator each year irrespective of traffic or passenger spend. The variable component is a share in the sales by the retailer, this rate is typically 20-40% of sales6. The variable component will only be payable to the airport operator once the MAG amount has been exceeded, if the variable portion falls below the MAG the retailer must pay the difference. Essentially this just places a floor on the amount that an airport will receive from the retailer.
Figure 9: Retail rent charged as the greater of two options
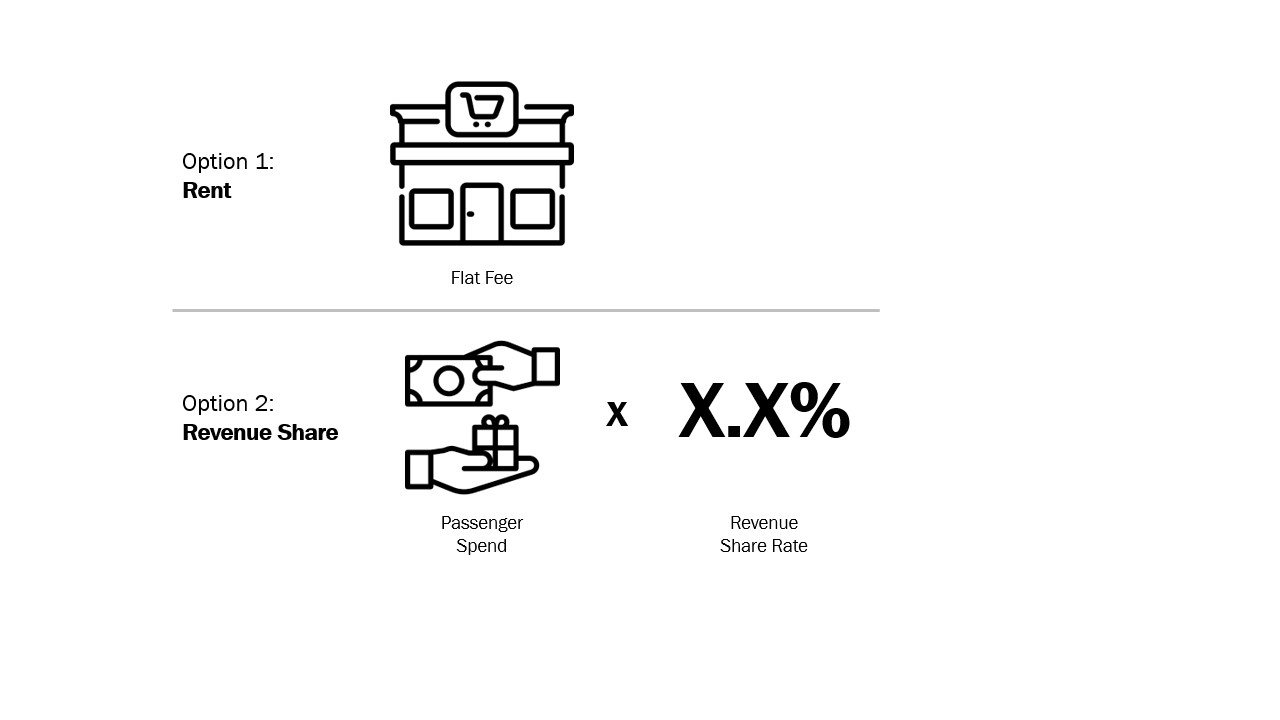
Source: Flaticon.com, First Sentier Investors.
As a result of the pandemic we anticipate that these minimum rents will increasingly be tied to passenger volumes, meaning that rather than guaranteeing a total rent the retailer will guarantee a rate of spend per passenger. This should see retail earnings volatility increase slightly, but also provides upside if airports are able to deliver significant increases in passenger numbers.
Whilst this shift does change the structure of the MAG, we continue to prefer those airports that operate under this structure rather than operating the duty free directly and have greater risk from a less favourable passenger mix (i.e. lower spend passengers).
Figure 10: The new duty free model
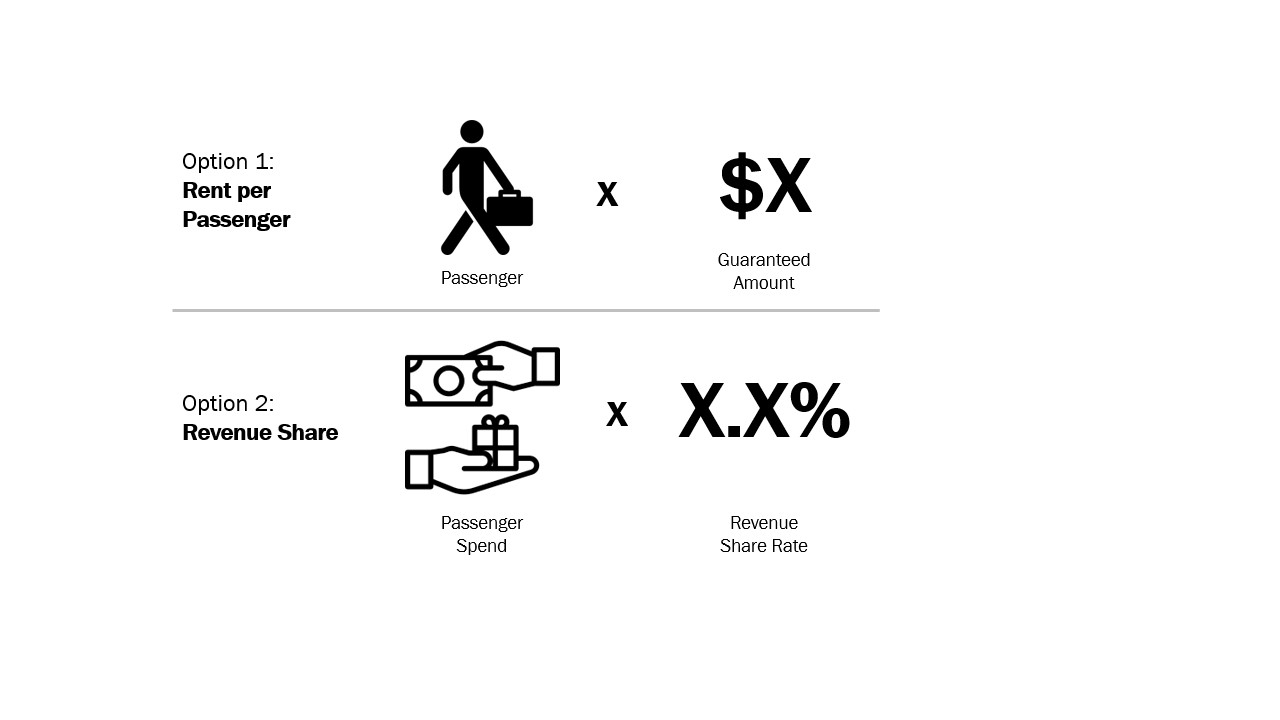
Source: Flaticon.com, First Sentier Investors.
More than just terminals & runways
One of the bright-spots for airports during the pandemic has been the real estate segments of a number of the listed airport companies. These assets have provided a steady stream of income with little-to-no correlation to the supressed passenger traffic, with many airports benefitting from the increased demand for cargo/industrial from ecommerce tenants in response to the boom in online shopping as a result of the pandemic.
Figure 11: Resilience of real estate
ADP quarterly revenue changes vs 2019
Source: ADP company reports.
As at 30 September 2021.
Airports typically sit on substantial land banks to facilitate airfield growth and protect residents from noise intrusion. These land holdings have allowed airport operators to develop this surplus land into substantial property portfolios. Portfolios which typically incorporate a mix of commercial, industrial, hotel and retail tenants.
Figure 12: Aena’s Madrid Airport real estate masterplan
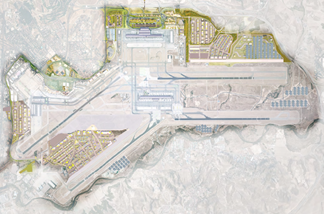
Source: Aena.
An example of these real estate activities is Zurich Airport’s 180,000 sqm commercial office and hotel development known as ‘The Circle’. A high quality asset providing a steady stream of income via long-term leasing agreements with a number of blue-chip tenants such as Microsoft, Volkswagen and Merck.
Figure 13: Zurich Airport ‘The Circle’ commercial development
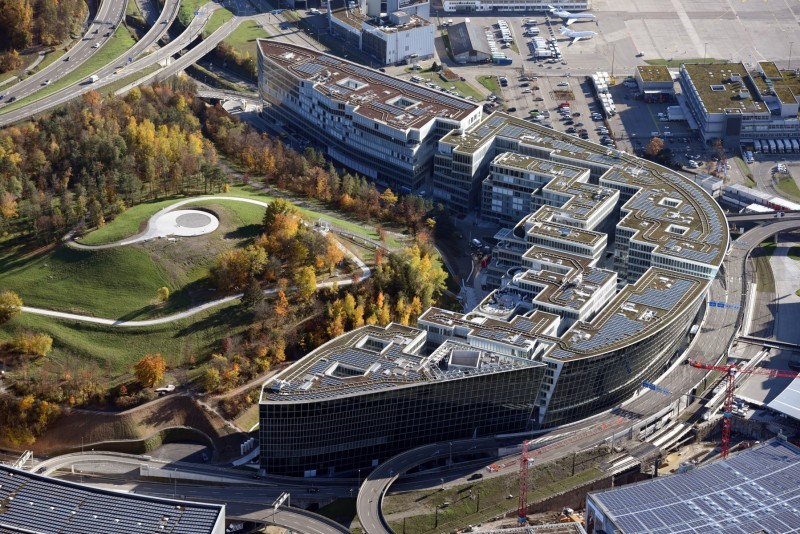
Source: Flughafen Zurich.
The pandemic has accelerated this trend toward real estate, with airport groups increasingly focusing on these activities. Many airports have sought to establish joint-ventures with major real estate firms, allowing them to monetise this land without significant capital outlay being required.
Figure 14: Real estate contribution to valuation estimate
Real estate as a share of First Sentier Investors valuation
Source: First Sentier Investors estimates.
As at 31 December 2021.
China reopening tailwinds or is the growth engine slowing?
China has been a key source of growth in the aviation industry for the past 20-years, with the expanding middle class in China leading to a 12% compounded annual growth rate in air travel between 2006 and 20197.
Figure 15: Air travel growth in China
China monthly airline passenger traffic
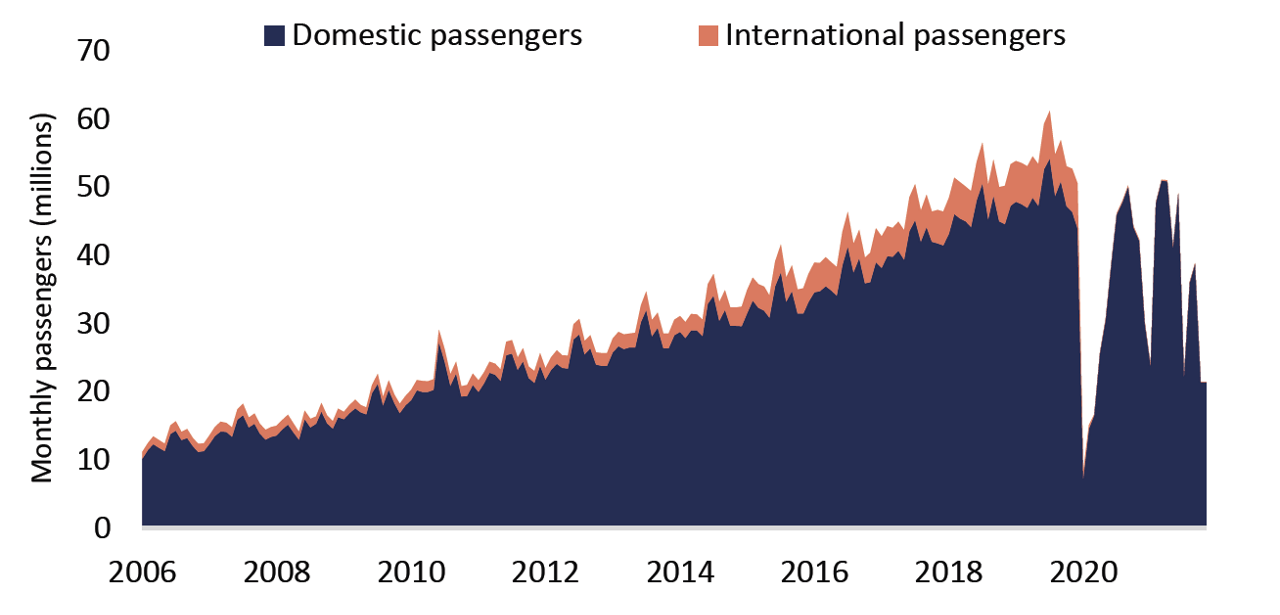
Source: First Sentier Investors estimates.
As at 31 December 2021.
In addition to the growth benefits that the aviation industry has seen from this evolving market, airports have further benefited from the high retail spend rates from these passengers. We estimate that Chinese travellers spend 4-5x that of the average passenger, meaning that any change in traffic has a disproportionate impact on earnings for the airports.
Figure 16: Chinese passenger retail impact
Aeroports de Paris – Chinese passenger exposure
Source: First Sentier Investors estimates.
For the year ended 31 December 2019.
However the pandemic has seen China’s borders shut for over two-years, adopting a zero-COVID approach whilst the rest of world seeks to find a way to live with the virus. The Chinese Government is yet to provide an indication of when these border restrictions may ease, although we can look towards events in 2022 that provide insight into a potential timeline. In February 2022 Beijing will host the Winter Olympics, whilst in October the communist party will hold its twice a decade party congress. We believe it is unlikely that a widespread reopening will occur prior to these events, with our assumption being that a meaningful reopening will commence from late-2022.
Developments in China’s domestic duty free market in Hainan further highlight the risk that this market will be permanently impacted by changes triggered by the pandemic. With the rapidly growing island located to the south of China benefitting from policy amendments made by the government which is seeking to promote the region as a Free Trade Port and keep more of the duty free spend in China rather than at airports around the world. This policy drastically expanded Hainan’s existing duty free program to allow visitors to spend RMB100,000 (~USD$15k), more than 3x the previous limit, and allow consumers to purchase duty free products online up to six months after returning home8.
Figure 17: Hainan, China

Source: Getty Images.
Hainan is set to pose a challenge to global airports with significant exposure to Chinese passengers, even once the Chinese border reopens. As a result we currently favour those airports that have more limited exposure to Chinese passengers, where this market provides positive growth optionality rather than presenting as a downside risk.
Figure 18: Passenger mix at major airports
Airport exposure to Chinese passengers
Source: company reports, Eurostat, Jarden, Thailand Department of Tourism,
First Sentier Investors estimates.
For the year ended 31 December 2019.
Note: includes Hong Kong.
Taking this analysis one step further and considering how significant this is from an earnings perspective we estimate that Chinese travellers were responsible for as much as 16% of pre-COVID EBITDA in the case of Auckland Airport. Whilst at the other end of the scale we estimate that this market contributed less than 1% of pre-COVID EBITDA for Spain’s Aena9.
Figure 19: Contribution of Chinese passengers to earnings
Estimated contribution of Chinese passengers in 2019
Source: company data; First Sentier Investors estimates. For the year ended 31 December 2019.
Note: Includes Hong Kong.
A flight path to net zero
Greater action on climate change is a positive not only for the planet, but also for the infrastructure asset class. Presenting opportunities for a number of our portfolio companies to help facilitate this decarbonisation process. However, careful consideration should be given to the pathway to net zero and the impact this will have on airports and their operations.
Whilst airports do not directly produce significant amounts of carbon themselves, their facilitation of air travel leads to material carbon emissions. Collectively the transport sector accounts for ~24% of global anthropogenic CO2 emissions, with aviation responsible for ~11% of transport emissions or ~3% of total emissions10.
Figure 20: Sector emissions
CO2 emissions by sector & transport sub-sector
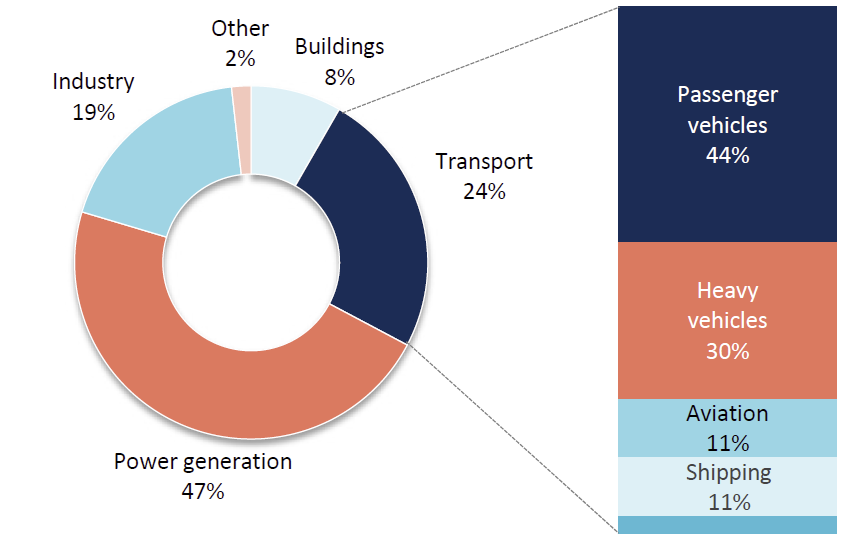
Source: IEA, First Sentier Investors.
For the year ended 31 December 2019.
The path to decarbonisation for the aviation sector is a process of gradual improvement that can be thought of in three distinct phases. The first is the improvement in aircraft efficiency, the evolution of aircraft since the start of the jet-age has seen significant advancements in jet engine design and composite fuselage materials for improved fuel burn efficiency.
Allowing airlines to reduce not only their fuel costs to make aviation more affordable, but improve the impact that these operations have on the environment. Developments have accelerated in recent years, with the latest aircraft up to 25% more fuel burn efficient than the previous generation aircraft11.
Figure 21: Net generation aircraft efficiency vs previous
Aircraft fuel burn efficiency gain vs previous generation aircraft
Source: Goldman Sachs, Boeing, Airbus.
The second stage is the broader adoption of sustainable aviation fuels (SAFs) by airlines. SAFs are developed from renewable sources such as cooking oil, municipal waste and woody biomass, serving as an alternative to conventional jet fuel. These alternative fuels are estimated to reduce aircraft lifecycle emissions by up to 80%12. However, at present the cost of SAFs is 3-4x that of conventional fuel, with SAFs only accounting for 0.1% of all jet fuel consumptions as a result13. Significant investment is required to increase the supply of SAFs to make the technology more affordable and allow greater adoption.
The third and final stage is the development of new zero-carbon impact propulsion technologies. These include the development of electric and/or hydrogen propulsion systems. These technologies are required in order to achieve the ultimate goal of net zero emissions from the sector, however it is important to note that these technologies are unlikely to reach widespread adoption before 2040. As a result, the immediate focus is undoubtedly on promoting the use of SAFs in order to ensure the sector can continue to grow in a decarbonising world.
Figure 22: Airbus zero emission pathway
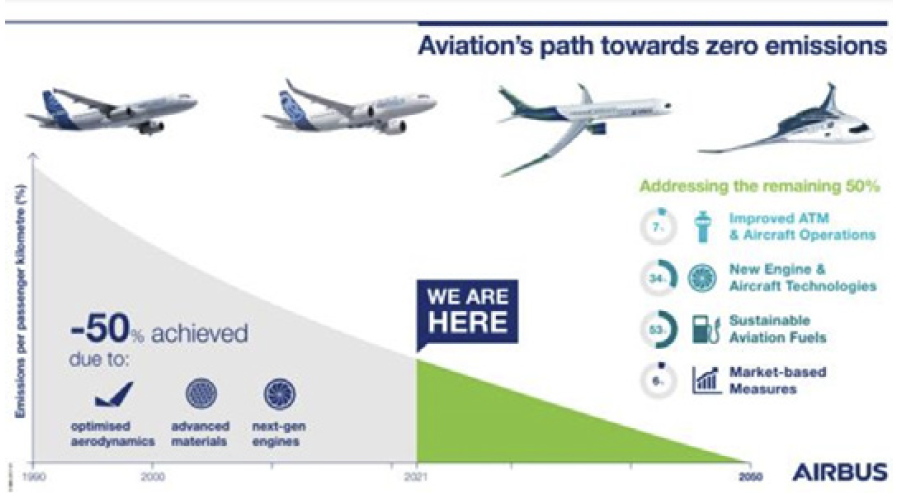
Source: Airbus.
The more immediate impact of this decarbonisation process for airports is the push towards high-speed rail as a lower carbon footprint transport alternative to air travel. We are increasingly seeing governments introduce measures to encourage high-speed rail via cost incentives and increased investment to reduce travel times on key routes. We consider any journeys which can be completed via rail in six hours or less to be at risk of disruption from these measures.
Figure 23: High speed rail disruption risk
Exposure to HSR routes of 6 hours or less
Source: EuroStat, RailEurope, FSI.
For the year ended 31 December 2019.
As a result, we favour those airports that serve populations that have limited or no high speed rail alternatives. We see these airports as not only serving a vital social need to connect communities, but also at a lower risk of having their traffic disrupted by high speed rail competition. Examples include Aena’s large exposure to the island airports of Spain which have no other viable connection to the mainland; such as their airports in Mallorca, Ibiza and the Canary Islands. Whilst for Zurich Airport we find that despite being situated in a country with one of the highest levels of per capita investment in high speed rail of any country Europe, the geographic challenges of mountainous Switzerland make flying the only viable journey for most key routes14.
Figure 24: Train at the entrance of the Gotthard Base Tunnel,
Switzerland – the world’s longest and deepest rail tunnel
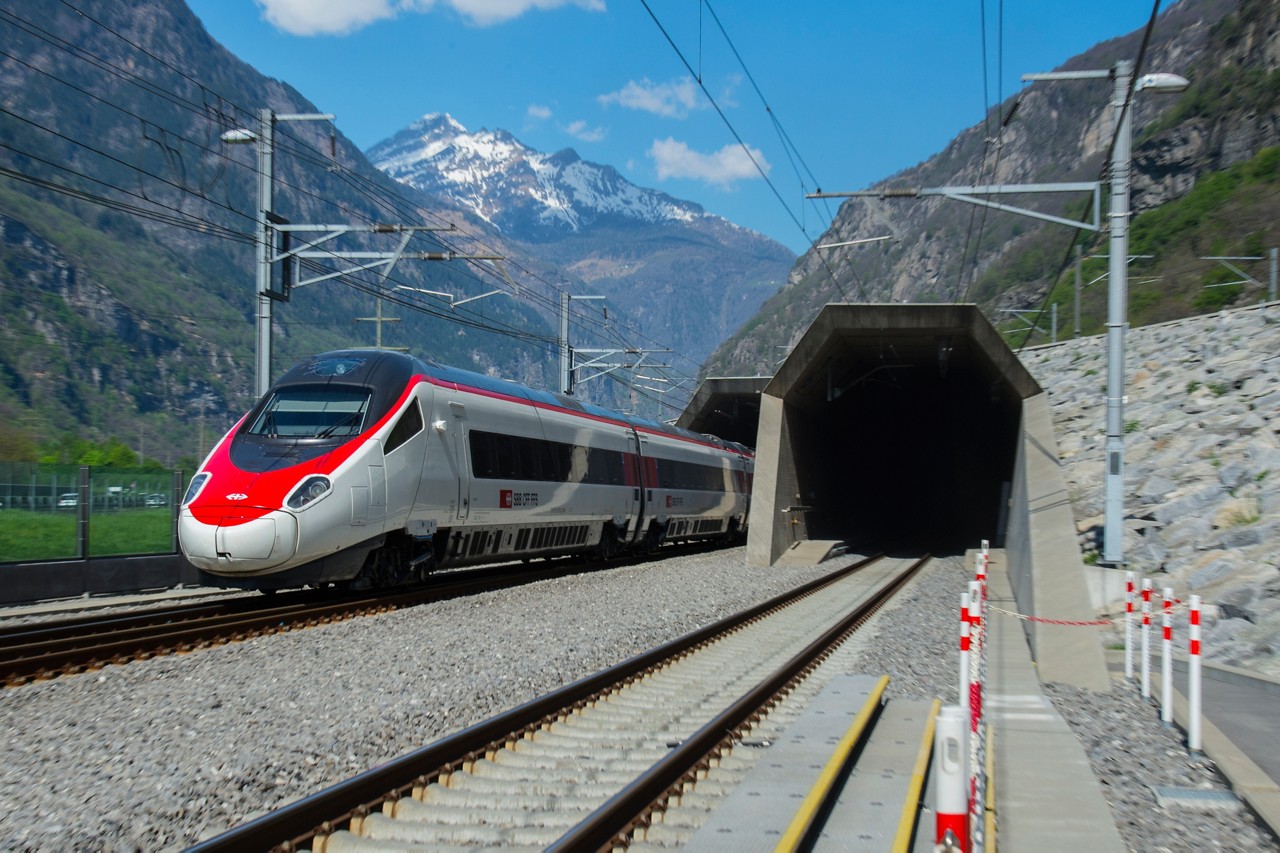
© AlpTransit Gotthard Ltd.
Conclusion
Whilst the pandemic continues to impact the way we live our lives, the clouds are slowly clearing on a path towards a return to some form of normalcy.
As this situation continues to develop we maintain our preference for short-haul, leisure exposed airports. Seeing fewer structural risks for these assets, with permanent traffic losses more limited and a greater number of positive catalysts for growth in the medium-term.
Looking beyond this recovery story we believe it is important to consider the lessons and changes for airports that have occurred as a result of the pandemic. As these developments will have significant impacts on the way these businesses operate and grow in 2022 and beyond.
The sector provides many opportunities for investors to gain exposure to multiple economic and social growth drivers in both developed and emerging markets. We are particularly optimistic about the growth potential of the real estate assets held by these companies, with these land parcels being highly valuable in an e-commerce economy which requires increased air freight and intermodal facilities.
However investor caution is required when considering the impacts of developments in the decarbonisation of the transportation sector and structural changes in China’s duty free market. Navigating these challenges will become increasingly important as air travel returns to some semblance of normality. We believe that the portfolio’s current position provides positive exposure to the structural growth in global air travel, whilst ensuring that these sector risks are managed appropriately.
1 Bloomberg 1 Sept. 2021 ‘‘Forever Changed’: CEOs Are Dooming Business Travel — Maybe for Good’.
2 Morgan Stanley ‘Global Corporate Travel Survey 2H21’.
3 Certain statements, estimates, and projections in this document may be forward-looking statements. These forward-looking statements are based upon First Sentier Investors’ current assumptions and beliefs, in light of currently available information, but involve known and unknown risks and uncertainties. Actual actions or results may differ materially from those discussed. Readers are cautioned not to place undue reliance on these forward-looking statements. There is no certainty that current conditions will last, and First Sentier Investors undertakes no obligation to correct, revise or update information herein, whether as a result of new information, future events or otherwise.
4 For illustrative purposes only. Reference to the names of each company mentioned in this communication is merely for explaining the investment strategy and should not be construed as investment advice or investment recommendation of those companies. Companies mentioned herein may or may not form part of the holdings of First Sentier Investors.
5 Aena, based on 2019 traffic volumes
6 First Sentier Investors, company data.
7 Civil Aviation Administration of China, Bloomberg.
8 McKinsey ‘Hainan’s $40 billion prize: The new battleground for global luxury’.
9 First Sentier Investors estimates.
10 IEA Tracking Transport 2020 and Tracking Aviation Reports.
11 Boeing & Airbus company data.
12 Airbus.
13 Bloomberg ‘Airlines Rush Toward Sustainable Fuel But Supplies Are Limited’. Data reflects fuel consumption in 2019.
14 Allianz pro Schiene and SBB CFF FFS.
Important information
This material is for general information purposes only. It does not constitute investment or financial advice and does not take into account any specific investment objectives, financial situation or needs. This is not an offer to provide asset management services, is not a recommendation or an offer or solicitation to buy, hold or sell any security or to execute any agreement for portfolio management or investment advisory services and this material has not been prepared in connection with any such offer. Before making any investment decision you should conduct your own due diligence and consider your individual investment needs, objectives and financial situation and read the relevant offering documents for details including the risk factors disclosure. Any person who acts upon, or changes their investment position in reliance on, the information contained in these materials does so entirely at their own risk.
We have taken reasonable care to ensure that this material is accurate, current, and complete and fit for its intended purpose and audience as at the date of publication but the information contained in the material may be subject to change thereafter without notice. No assurance is given or liability accepted regarding the accuracy, validity or completeness of this material.
To the extent this material contains any expression of opinion or forward-looking statements, such opinions and statements are based on assumptions, matters and sources believed to be true and reliable at the time of publication only. This material reflects the views of the individual writers only. Those views may change, may not prove to be valid and may not reflect the views of everyone at First Sentier Investors.
Past performance is not indicative of future performance. All investment involves risks and the value of investments and the income from them may go down as well as up and you may not get back your original investment. Actual outcomes or results may differ materially from those discussed. Readers must not place undue reliance on forward-looking statements as there is no certainty that conditions current at the time of publication will continue.
References to specific securities (if any) are included for the purpose of illustration only and should not be construed as a recommendation to buy or sell the same. Any securities referenced may or may not form part of the holdings of First Sentier Investors’ portfolios at a certain point in time, and the holdings may change over time.
References to comparative benchmarks or indices (if any) are for illustrative and comparison purposes only, may not be available for direct investment, are unmanaged, assume reinvestment of income, and have limitations when used for comparison or other purposes because they may have volatility, credit, or other material characteristics (such as number and types of securities) that are different from the funds managed by First Sentier Investors.
Selling restrictions
Not all First Sentier Investors products are available in all jurisdictions.
This material is neither directed at nor intended to be accessed by persons resident in, or citizens of any country, or types or categories of individual where to allow such access would be unlawful or where it would require any registration, filing, application for any licence or approval or other steps to be taken by First Sentier Investors in order to comply with local laws or regulatory requirements in such country.
This material is intended for ‘professional clients’ (as defined by the UK Financial Conduct Authority, or under MiFID II), ‘wholesale clients’ (as defined under the Corporations Act 2001 (Cth) or Financial Markets Conduct Act 2013 (New Zealand) and ‘professional’ and ‘institutional’ investors as may be defined in the jurisdiction in which the material is received, including Hong Kong, Singapore and the United States, and should not be relied upon by or be passed to other persons.
The First Sentier Investors funds referenced in these materials are not registered for sale in the United States and this document is not an offer for sale of funds to US persons (as such term is used in Regulation S promulgated under the 1933 Act). Fund-specific information has been provided to illustrate First Sentier Investors’ expertise in the strategy. Differences between fund-specific constraints or fees and those of a similarly managed mandate would affect performance results.
About First Sentier Investors
References to ‘we’, ‘us’ or ‘our’ are references to First Sentier Investors, a global asset management business which is ultimately owned by Mitsubishi UFJ Financial Group (MUFG). Certain of our investment teams operate under the trading names FSSA Investment Managers, Stewart Investors and Realindex Investments, all of which are part of the First Sentier Investors group.
This material may not be copied or reproduced in whole or in part, and in any form or by any means circulated without the prior written consent of First Sentier Investors.
We communicate and conduct business through different legal entities in different locations. This material is communicated in:
• Australia and New Zealand by First Sentier Investors (Australia) IM Limited, authorised and regulated in Australia by the Australian Securities and Investments Commission (AFSL 289017; ABN 89 114 194311)
• European Economic Area by First Sentier Investors (Ireland) Limited, authorised and regulated in Ireland by the Central Bank of Ireland (CBI reg no. C182306; reg office 70 Sir John Rogerson’s Quay, Dublin 2, Ireland; reg company no. 629188)
• Hong Kong by First Sentier Investors (Hong Kong) Limited and has not been reviewed by the Securities & Futures Commission in Hong Kong. First Sentier Investors is a business name of First Sentier Investors (Hong Kong) Limited.
• Singapore by First Sentier Investors (Singapore) (reg company no. 196900420D) and has not been reviewed by the Monetary Authority of Singapore. First Sentier Investors (registration number 53236800B) is a business division of First Sentier Investors (Singapore).
• Japan by First Sentier Investors (Japan) Limited, authorised and regulated by the Financial Service Agency (Director of Kanto Local Finance Bureau (Registered Financial Institutions) No.2611)
• United Kingdom by First Sentier Investors (UK) Funds Limited, authorised and regulated by the Financial Conduct Authority (reg. no. 2294743; reg office Finsbury Circus House, 15 Finsbury Circus, London EC2M 7EB)
• United States by First Sentier Investors (US) LLC, authorised and regulated by the Securities Exchange Commission (RIA 801-93167).
To the extent permitted by law, MUFG and its subsidiaries are not liable for any loss or damage as a result of reliance on any statement or information contained in this document. Neither MUFG nor any of its subsidiaries guarantee the performance of any investment products referred to in this document or the repayment of capital. Any investments referred to are not deposits or other liabilities of MUFG or its subsidiaries, and are subject to investment risk, including loss of income and capital invested.
© First Sentier Investors Group
Get the right experience for you
Your location :  Spain
Spain
Australia & NZ
-
 Australia
 -
 New Zealand
Asia
-
 Hong Kong (English)
 -
 Hong Kong (Chinese)
 -
 Singapore
 -
 Japan
Japan







 United Kingdom